Will Solana’s price escape its tightening symmetrical triangle after the MACD bullish signal?
Solana is trading at $83.37 as of April 14, down 3.63% on the day, while price action continues to coil inside a two‑month‑old symmetrical triangle on the daily chart. This consolidation pattern is now pressing toward its apex, and a fresh bullish crossover on the daily MACD has injected a new momentum cue into an already tense technical setup.
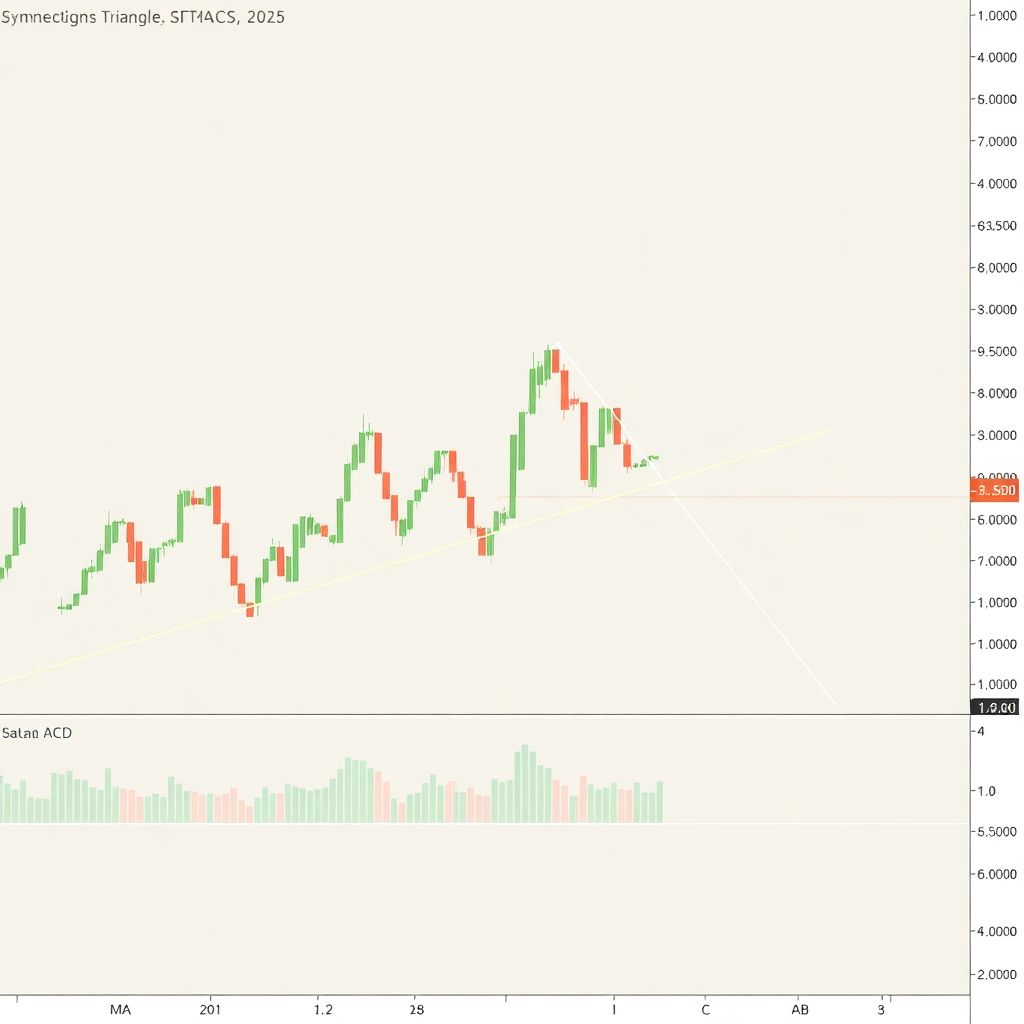
Symmetrical triangle squeezes price toward decision point
Since mid‑February, Solana’s price has been moving within a classic symmetrical triangle, defined by a descending upper trendline drawn from the February swing highs and an ascending lower trendline anchored to the cycle lows. Each rally has been capped by progressively lower resistance, while each sell‑off has been met by increasingly higher bids, creating a compressing range.
This structure has survived March’s Iran‑related volatility and extended into April without a decisive break on either side. Price is now trading close to the triangle’s apex, the zone where the pattern can no longer contain price and a sharp breakout or breakdown typically follows as built‑up energy is released.
MACD delivers a bullish crossover inside the pattern
The MACD (12,26,9) on the daily timeframe has just flipped into a bullish configuration inside the triangle. The MACD line, now at -0.72, has crossed above the signal line at -1.16, while the histogram has turned positive around 0.45 and is expanding.
Both MACD lines are still below the zero line, which tempers the strength of the signal and suggests the broader momentum backdrop remains cautious rather than decisively bullish. However, the positive and growing histogram implies that bearish momentum is fading and buyers are gradually regaining control. Historically, symmetrical triangle resolutions that align with an existing MACD crossover tend to exhibit stronger follow‑through than breakouts occurring against flat or conflicting momentum.
Moving averages stacked as layered resistance
One of the immediate challenges for bulls is the alignment of the key simple moving averages, all currently sitting above spot price and acting as overhead resistance:
– 20‑day SMA: $82.74
– 50‑day SMA: $85.61
– 100‑day SMA: $98.42
– 200‑day SMA: $129.44
This “bear stack” of moving averages means that even if Solana breaks out of the triangle, it must sequentially reclaim these levels to confirm a durable trend shift. For now, the 20‑day SMA at $82.74 doubles as the first line of support and the level buyers must defend on a daily closing basis to keep the bullish scenario intact.
Key support and invalidation levels
From a downside perspective, the technical structure provides a clear hierarchy of levels:
– Immediate support: 20‑day SMA at $82.74
– Next support: Lower triangle trendline around $80
– Structural breakdown zone: Daily close below ~$76, which would violate the ascending base of the triangle
A daily close below the lower boundary near $76 would effectively invalidate the bullish triangle narrative and shift the bias firmly in favor of sellers. In broader terms, a daily close below $80 is treated as the primary invalidation level for the current bullish continuation thesis.
Resistance ladders and upside targets
On the way up, bulls face a sequence of resistance levels that need to be cleared to unlock higher targets:
– First resistance: 50‑day SMA at $85.61
– Next hurdle: 100‑day SMA at $98.42
– Extended target zone: $108-$110, derived from the triangle’s measured move
For a clean bullish breakout, traders will be looking for a daily close above the 50‑day SMA at $85.61, ideally accompanied by rising volume and an expanding positive MACD histogram. A sustained move above $85.61 would validate the triangle breakout and set $98.42 (the 100‑day SMA) as the primary technical waypoint, with the $108-$110 region representing the fuller measured‑move objective.
Macro targets and on‑chain context
Analysts have highlighted $108 as the next major upside objective for Solana if price can hold above the key $87 zone and maintain bullish momentum, while the $80 region is viewed as a structural floor that bulls are actively defending.
At the same time, Solana’s network fundamentals have shown extraordinary growth. Total economic activity on the network reportedly reached $1.1 trillion in Q1 2026, marking a 6,558% increase compared to the previous quarter. This suggests a growing disconnect between the strength of underlying network usage and the compressed, indecisive price action on the chart. For longer‑term participants, such a divergence is often interpreted as latent upside potential once technical headwinds clear.
Derivatives dominate as open interest swells
On the derivatives front, Solana open interest stands at $5.01 billion, while futures volume over the past 24 hours has reached $10.98 billion. By contrast, spot trading volume is around $630 million for the same period. This imbalance confirms that derivatives traders, rather than spot buyers and sellers, are currently driving price discovery.
Such positioning can act as an accelerant for any breakout from the triangle. When price finally moves decisively higher or lower, leveraged traders on the wrong side of the move are likely to be forced out of their positions, triggering liquidations that amplify volatility. Around $8.1 million in Solana futures positions were liquidated in the latest 24‑hour window, an early indication of how sensitive the market already is to relatively modest price swings.
Institutional presence and structural demand
Beyond retail and short‑term derivative activity, institutional interest in Solana has quietly grown. In March, it was noted that around 30 institutional investors had accumulated roughly $540 million in Solana ETF exposure, with Electric Capital and Goldman Sachs among the largest holders.
This level of institutional participation can serve as a structural demand base, particularly near current price levels. While it does not guarantee short‑term price appreciation, it suggests that any deep dips may attract strategic buying from players with longer‑term investment horizons, softening the downside and supporting the thesis that current compression is more consolidation than distribution.
What needs to happen for a bullish breakout?
For the bullish scenario to play out in full, several elements need to align:
1. Hold key support: Price must maintain daily closes above the 20‑day SMA at $82.74 and ideally stay above the $80 floor.
2. MACD follow‑through: The MACD histogram should continue to expand in positive territory, with both lines pushing toward or above the zero line, confirming a shift to positive momentum.
3. Break and close above the triangle and 50‑day SMA: A decisive daily close over the upper triangle boundary and the $85.61 50‑day SMA would signal that buyers have seized control.
4. Volume confirmation: Rising volume, particularly in spot markets, would help validate the move and reduce the risk of a false breakout driven purely by derivatives activity.
If these conditions are met, a move toward the 100‑day SMA at $98.42 becomes the base case, with the $108 measured‑move area as the logical extension if bullish sentiment intensifies.
What could trigger a bearish breakdown instead?
On the other hand, several warning signs would tilt the odds toward a bearish outcome:
– Failure to hold $82.74 on closing basis, leading to repeated tests of the $80 area
– MACD rolling over, with the histogram shrinking back toward zero or flipping negative again
– A daily close below the lower triangle trendline near $76, negating the ascending support structure
– An uptick in long liquidations and a rapid drop in open interest, signaling a washout of bullish leverage
In that scenario, the symmetrical triangle would resolve downward, and Solana could revisit deeper support zones below the current structure, with the $70-$75 area becoming relevant again depending on broader market conditions.
Short‑term outlook: consolidation with a bullish tilt
In the immediate term, as long as Solana holds $82.74 on daily closes and the MACD histogram continues to expand positively, the path of least resistance leans toward a retest of the 50‑day SMA at $85.61. A confirmed break and close above that level would likely mark the official breakout from the symmetrical triangle, activating the $98.42 and then $108 targets.
However, traders should remain aware that symmetrical triangles are neutral patterns by nature: they can break in either direction. The newly confirmed MACD bullish crossover tilts the probabilities slightly in favor of an upside resolution, but the final verdict will be delivered at the apex, where price can no longer remain compressed.
In summary, Solana stands at a critical juncture. A bullish MACD crossover, robust on‑chain growth, and institutional demand argue for a breakout higher, while stacked moving average resistance and derivatives‑driven volatility keep risks elevated. The key thresholds are clear: hold above $80 and reclaim $85.61 for a potential run toward $98 and $108; lose the lower trendline near $76, and the market’s bias flips decisively bearish.