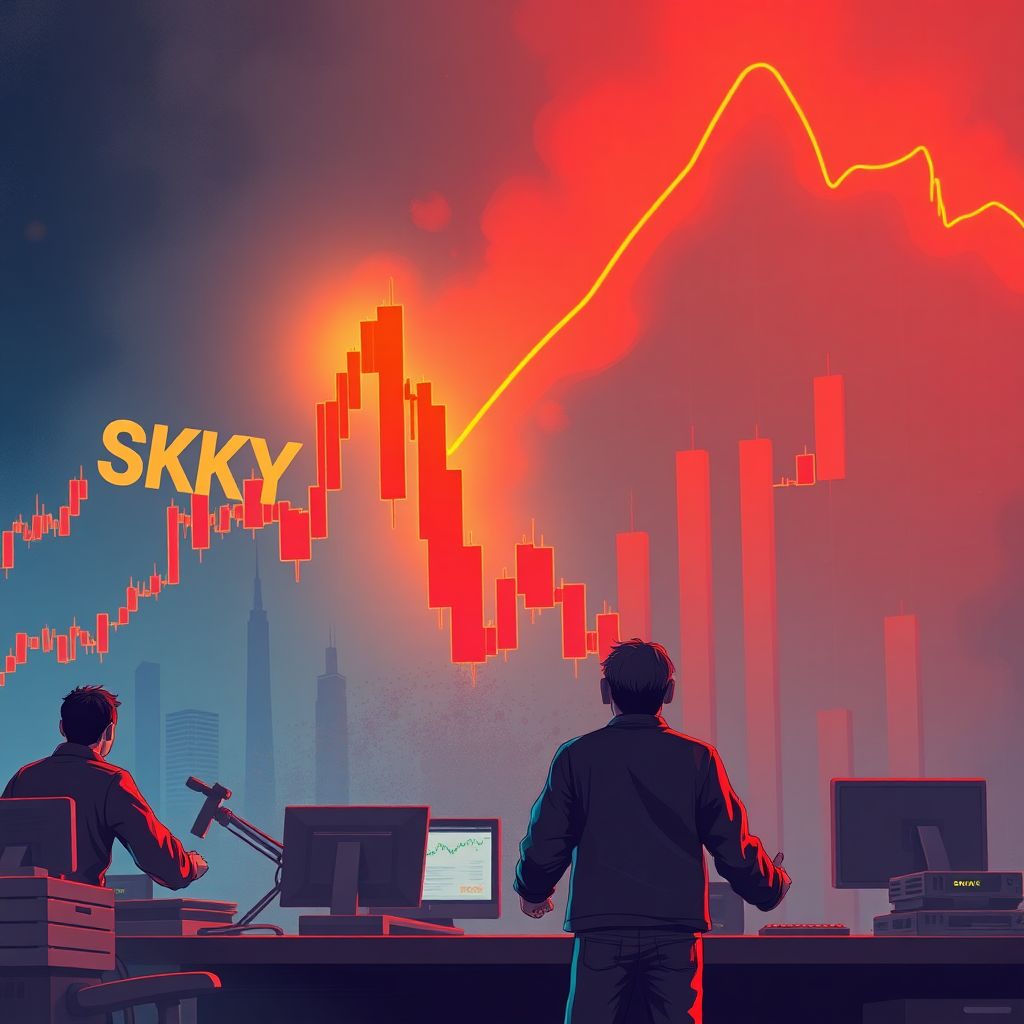
SKYAI drops over 30% in a day: is $0.13 the last line of defense, or just a stop on the way down?
SKYAI suffered a brutal sell-off over the last 24 hours, tumbling 30.53% as selling pressure intensified across the market. The token recorded one of its steepest daily red candles in recent weeks, abruptly interrupting a strong rebound phase that had only just begun to gain traction.
Despite the heavy price decline, trading activity did not dry up – it exploded. Intraday volume surged by 253.8% to roughly $163.3 million, signaling that the move was not driven by apathetic selling, but by an active battle between aggressive bears and bargain-hunting bulls. High volume during a dump typically reflects strong conviction on both sides, but in this case, sellers clearly had the upper hand.
The reversal came shortly after a powerful recovery rally. Previously, SKYAI had climbed around 80% to reach a local high near $0.3070, drawing renewed attention after a stretch of sluggish, range-bound trading. That move suggested buyers were regaining control and positioning for a broader trend reversal. However, they failed to build on that momentum. The recent crash wiped out a large chunk of those gains, reminding traders how fragile bullish setups can be in highly speculative altcoins.
Throughout the decline, activity stayed elevated, showing that many market participants continued to reposition rather than step aside. Buyers attempted to defend key levels, while sellers used every bounce as an opportunity to unload, reinforcing the downward trend.
On the derivatives front, speculative appetite cooled markedly. Open Interest in SKYAI futures and perpetuals shrank by 34.93%, sliding to about $72.33 million. That sharp contraction signaled that leveraged traders were closing positions and pulling capital out of the market rather than aggressively adding fresh shorts into the drop.
The combination of falling prices and falling Open Interest is important. It typically means traders are exiting both long and short positions rather than betting heavily on continued downside. Instead of a crowded bearish pile-on, the market appears to be going through a broad deleveraging phase, where participants prefer to scale back risk and wait for clearer signals.
This flush-out of leverage has two opposing implications. On one hand, it underlines weakening speculative demand and diminished confidence in short-term upside. On the other, it removes a layer of “excess froth” from the market, potentially setting the stage for a more sustainable move once a new equilibrium is found. Markets often stabilize or even bounce after a significant reduction in leveraged positioning, assuming no fresh negative catalysts emerge.
From a structural perspective, SKYAI remains firmly locked in a downtrend. The token continues to trade within a descending channel that has contained price action since the earlier peak near $0.80. Recent candles are gravitating toward the lower boundary of this channel, with the price hovering around $0.14. This zone has become a critical decision area, where either a short-term bottom can form or the next leg of the sell-off can begin.
Immediate support sits in the $0.13 region, which now acts as the key line in the sand for bulls. A sustained break below this zone would not only take price out of the current consolidation base, but could also invalidate attempts at forming a short-term bottom. On the upside, the nearest notable resistance is found around $0.27, a level that capped previous recovery efforts and will likely attract sellers again if price revisits it.
Technical indicators currently lean bearish, although some early signs of exhaustion are emerging. The Relative Strength Index (RSI) has dropped to 35.86, approaching the oversold threshold. This reading confirms that selling pressure still dominates, but the fact that RSI is nearing the lower band of its range suggests that the pace of the decline may begin to slow if buyers step in near support.
The MACD indicator also paints a cautious picture. The MACD line remains below its signal line, and the histogram still prints negative bars, confirming that downward momentum is intact. However, after a prolonged down move, such readings can sometimes precede a relief bounce as momentum starts to normalize. The key is whether price can defend support while these indicators hover in weak but potentially stabilizing territory.
Interestingly, while the broader market sentiment around SKYAI has grown nervous, top derivatives traders on Binance have not capitulated. Their positioning remains decisively skewed to the long side. Longs make up about 70.07% of all positions, while shorts account for only 29.93%. This yields a Long/Short Ratio of 2.34, which is notably high given the scale of the recent drawdown.
This tilt in positioning suggests that experienced traders are still framing the drop as a corrective pullback within a broader opportunity, rather than the start of an extended collapse. They appear to be betting that the market will eventually recover from current levels, or at least offer a meaningful bounce that can be traded profitably from the long side.
However, such optimism is a double-edged sword. If SKYAI fails to hold the $0.13-$0.14 area and breaks decisively lower, the large concentration of long exposure could quickly turn from a sign of confidence into a vulnerability. Forced liquidations of overleveraged long positions could accelerate the next wave down, amplifying volatility and potentially driving price well below current support zones.
This puts the market at a pivotal juncture. A successful defense of $0.13 would likely confirm it as a short-term floor, inviting dip-buyers and sidelined capital back into the market. In that scenario, a relief rally toward the mid-range of the descending channel (and possibly up to the $0.27 resistance) becomes increasingly plausible. Conversely, a firm breakdown beneath support would signal that the sellers remain in clear control, opening the door to fresh lows and an extension of the existing downtrend.
Is SKYAI forming a capitulation bottom? Several pieces of evidence suggest that a local bottom could be in the making, even if it has not been fully confirmed yet. The combination of heavy volume, rapid price decline, aggressive reduction in Open Interest, and an RSI nearing oversold levels often appears around capitulation points. During such phases, weak hands exit, leverage is cleansed, and stronger, longer-term players begin to accumulate gradually.
Yet, a capitulation bottom is best confirmed not just by technical signals, but by subsequent price behavior. Traders will look for a sequence of higher lows, reduced intraday volatility, and improved breadth in buying activity. A rebound from $0.13 with follow-through – not just a short-lived dead-cat bounce – would be the clearest evidence that a local floor has been set.
For short-term traders, the current structure presents a classic high-risk, high-reward setup. Entering long positions near the $0.13-$0.14 zone offers attractive upside potential if price rebounds toward $0.20-$0.27. However, the risk of a breakdown and further downside remains significant, especially with a large cluster of longs already in the system. Tight risk management, including clearly defined stop-loss levels below support and position sizing that reflects volatility, is critical.
Swing traders and longer-term speculators may prefer to wait for confirmation. A reclaim of intermediate resistance levels, a bullish crossover on MACD, or an RSI recovery back above neutral territory (50+) could provide stronger confirmation that the worst of the selling is over. Until then, the prevailing trend is still down, and counter-trend trades inherently carry greater risk.
From a broader perspective, SKYAI’s situation also illustrates a common pattern in the altcoin market: sharp rallies after periods of consolidation, followed by equally violent corrections when profit-taking and risk-off sentiment collide. Assets with relatively young histories and thin liquidity can see exaggerated price swings in both directions. In such environments, understanding market structure and positioning data becomes as important as tracking the headline price.
Traders should also pay attention to potential fundamental or narrative catalysts that could either support or undermine the technical picture. Developments such as protocol upgrades, new partnerships, exchange listings, or regulatory news can quickly shift sentiment and override short-term technical setups. Similarly, negative headlines, security issues, or broader market risk events can add pressure to already weakened charts.
In the coming days, the key variables to monitor will be:
– Whether price can hold above $0.13 and form a stable base.
– How Open Interest behaves: further contraction may signal continued risk-off, while a gradual, measured rebuild could indicate renewed confidence.
– Changes in the Long/Short Ratio: an extreme imbalance sustained for too long can precede sharp squeezes in either direction.
– RSI and MACD transitions: a stabilization or early bullish divergence would strengthen the case for a relief rally.
For now, SKYAI stands at a crossroads. It is approaching a technically significant support area at the lower boundary of its descending channel, with speculative leverage having been partially flushed from the system and top traders still leaning bullish. If buyers manage to defend the $0.13 region, the stage could be set for a recovery attempt toward higher resistance levels. If that defense fails, the current move may only be a midway point in a deeper corrective phase, rather than the end of the downturn.