Chainlink: Why a Break Back Above $13 Is Key Before LINK Can Target $14–$16
Chainlink’s on-chain and market structure signals are quietly turning constructive, even as the token trades under pressure near the 12-dollar area. Behind the scenes, reserves are growing, leverage is being flushed out, and a critical demand zone continues to hold – all of which shape a clearer roadmap for a potential move toward 14 and eventually 16 dollars.
Reserves Expand While Price Pulls Back
Chainlink’s reserve balances have been climbing despite the broader market weakness. An additional 92,946.23 LINK was recently added, bringing total reserves to roughly 1,232,139.92 LINK.
Crucially, this accumulation did not take place during a euphoric rally but while LINK hovered around 12.22 dollars, close to a multi-week demand area. When reserves increase during a drawdown rather than during upside momentum, it typically reflects longer-term conviction rather than short-term speculation.
Growing reserves reduce circulating supply pressure over time and create a more robust defensive layer for the network. This kind of activity rarely generates an instant vertical rally. Instead, it alters how the asset behaves once fresh demand arrives – pullbacks tend to be shallower, and recoveries become more sustainable.
This divergence between weak price action and strengthening network structure is often seen in the later stages of corrective phases, when sentiment looks fragile on the surface but underlying positioning begins to improve.
Spot Buyers Quietly Absorb Selling
Spot market flows help explain why Chainlink has not broken down more aggressively despite the persistent selling environment. The 90‑day Spot Taker Cumulative Volume Delta (CVD) remains firmly positive, indicating buy orders are consistently outweighing sell orders over this period.
In other words, market participants are still willing to lift offers rather than sit back and wait for much deeper discounts. This has remained true even as LINK retreated from the 16–17 dollar range toward the low 12s.
However, this underlying strength is partially obscured by what is happening in the derivatives arena. While spot buyers steadily absorb coins, forced selling from leveraged traders has been applying additional downward pressure on the chart, making price appear weaker than spot demand alone would suggest.
Under these conditions, downside often loses energy as price moves into well-bid zones, since organic sellers are not aggressively pushing the token lower – much of the pressure is coming from liquidations rather than fresh bearish conviction.
Leverage Reset: Liquidations Tell the Story
Liquidation statistics reinforce the idea that the latest leg down was driven more by leverage washes than by a structural shift in sentiment. Total liquidations recently sat near 213,000 dollars, with roughly 167,24 thousand dollars in short liquidations and about 46,03 thousand dollars in long liquidations.
Major derivatives venues show that a notable portion of these liquidations came from aggressive short and long positioning being wiped out, rather than from new, confident directional selling. This pattern often marks a reset phase in which both overleveraged longs and shorts are forced out, clearing the way for more organic price discovery.
Repeated long liquidations gradually drain the “fuel” for deeper cascades. Once many of the weakest long hands have been flushed out, each additional wave of selling has less impact. At the same time, if short interest grows too rapidly, the market becomes more vulnerable to sharp upside squeezes when price finally turns.
In such an environment, liquidation activity begins to signal exhaustion, not the start of a powerful new downtrend.
Demand Zone at $11.8–$12.2 Remains the Key Line of Defense
Technically, LINK continues to respect a well-defined demand area between 11.8 and 12.2 dollars. Buyers have stepped in to defend this zone multiple times, turning it into a crucial short-term floor.
Each visit to this region has seen sell pressure absorbed before any decisive breakdown could take hold. That repeated defense is particularly important in a market still dealing with deleveraging because it shows that real spot interest exists at these levels, not just mechanical buying.
Momentum indicators also suggest that bearish pressure is slowing rather than accelerating. The Relative Strength Index (RSI) hovers around 40.81, while its signal line sits near 33.16. These readings are consistent with a market that is cooling off from a selloff, often seen during base‑building stages when price begins to compress and prepare for a new directional move.
As long as LINK stays above the 11.8–12.2 support pocket, downside risk looks contained. A clean break below this range would change the picture and open the door to a deeper correction, but for now, the balance of evidence favors stabilization.
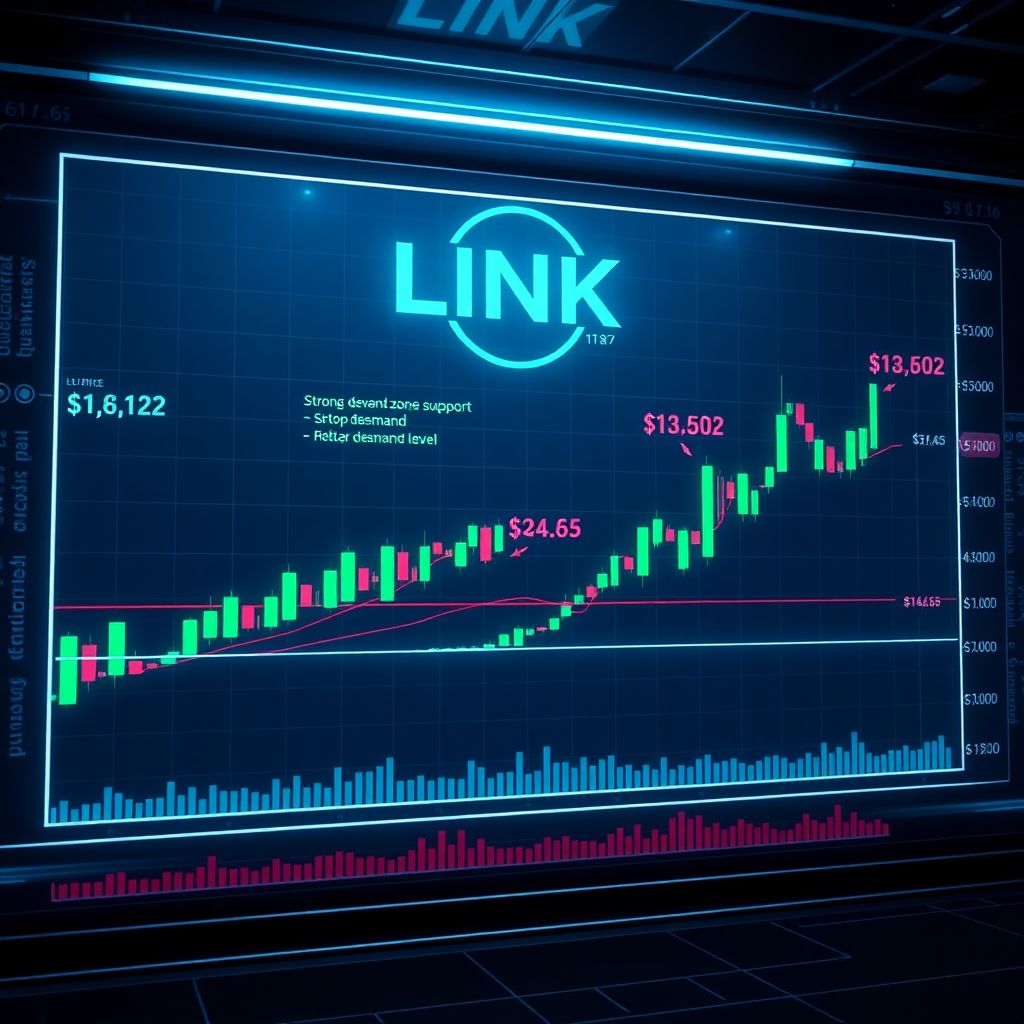
Why $13.02 Is the First Line to Reclaim
While holding the demand zone is essential, it is not enough by itself to trigger a convincing recovery. For bulls to regain the initiative, LINK needs to climb back above 13.02 dollars and hold that level.
Reclaiming 13.02 would serve as a short‑term confirmation that buyers are not just defending support, but are strong enough to push price into a higher trading range. It would effectively turn the current sideways-to-down bias into a more constructive consolidation, with the market starting to price in a potential attack on higher resistance levels.
Such a reclaim would also put pressure on late-arriving shorts who entered near the lows, forcing them to reconsider their positions and potentially adding to upside momentum as they cover.
$14.65 and $16.66: The Next Major Hurdles
Above 13.02 dollars, the technical landscape becomes more interesting. A decisive move through 14.65 dollars would invalidate the prevailing lower‑high structure on the chart, signaling that the corrective trend may be giving way to a new recovery leg.
Once 14.65 is breached with volume and follow‑through, the path opens toward the next key resistance around 16.66 dollars. This level marks the upper boundary of the current recovery roadmap and would likely attract profit‑taking as well as renewed selling interest from medium‑term traders.
Therefore, the broader bullish scenario unfolds in stages:
1. Hold the 11.8–12.2 demand zone.
2. Reclaim and sustain trade above 13.02.
3. Break and hold above 14.65 to target the 16.66 region.
Liquidity Clusters Point Upward, Not Down
Recent 24‑hour liquidation heatmaps for a major futures venue reveal dense liquidity clusters between 12.6 and 13.2 dollars, with another significant pocket of liquidity positioned near 14.65 dollars.
These clusters act like magnets for price in a highly leveraged market because liquidations tend to trigger when those areas are probed. As downside liquidity around 11.7 dollars has largely been cleared, immediate risk of a deep breakdown is diminished, at least in the short term.
With leverage now thinner and spot demand still present, LINK becomes more sensitive to moves higher. A move above 13.02 could rapidly draw price toward the 14.65 liquidity pocket as shorts are forced to close. If that region is cleared, attention naturally shifts to the 16.66 area as the next thick band of likely activity.
This alignment between liquidity placement and key resistance levels reinforces the idea of a recovery trajectory rather than prolonged sideways compression or a steep new decline.
How This Fits Into Chainlink’s Broader Market Cycle
From a broader cycle perspective, Chainlink has already moved through several phases: an impulsive advance, followed by distribution at higher levels, and now a corrective drawdown. The current data – reserve expansion, spot absorption, easing liquidations, and defended demand – resembles late‑correction behavior.
Such periods are often marked by apathy, low optimism, and choppy pricing that grinds out impatient market participants. Yet, this is also when structural groundwork for the next leg up is quietly laid: stronger hands accumulate, leverage is normalized, and technicals begin to form a base.
This does not guarantee an immediate rally, nor does it rule out another dip into the demand zone. But it does suggest that each successive test of the lows is more likely to encounter resilient buying rather than panic selling, provided macro conditions in the wider crypto market do not deteriorate dramatically.
What Traders Might Watch in the Short Term
In the near term, active traders are likely to monitor several key elements:
– Behavior around 11.8–12.2 dollars: A clean defense with strong volume reinforces the bullish base; a breakdown with expanding volume would invalidate the current stabilization thesis.
– RSI and momentum: A shift of RSI back above the neutral 50 zone, particularly after an extended period near 40, would strengthen the case for an emerging uptrend.
– Reaction at 13.02 dollars: Rejection here would signal that bears still control the short‑term structure; a strong reclaim with limited pullback would favor further upside.
– Open interest and funding rates: A renewed surge in high‑leverage longs without corresponding spot demand could create another vulnerability, whereas balanced or slightly short‑leaning positioning would make any breakout more sustainable.
Strategic Implications for Different Market Participants
For long‑term participants focused on fundamentals and multi‑month horizons, the combination of rising reserves and a defended demand zone may be seen as an opportunity to gradually accumulate rather than a reason to panic.
For short‑term traders, the playbook is more tactical: some may look to buy near the demand zone with tight invalidation below 11.8, while others may prefer to wait for strength to prove itself via a confirmed reclaim of 13.02 before committing capital.
Aggressive bears, meanwhile, are likely to target the 14.65 and 16.66 levels as potential re‑entry zones to fade rallies, especially if the broader crypto market shows signs of fatigue.
Final Outlook: Stabilization with an Upside Bias
Overall, Chainlink’s current structure is shifting from deterioration toward stabilization. Reserve balances above 1.23 million LINK, robust spot‑side absorption, and declining liquidation pressure collectively indicate that much of the recent downside may be nearing exhaustion.
As long as price continues to hold the 11.8–12.2 dollar demand zone, the balance of risk tilts to the upside. Regaining 13.02 dollars would be the first technical confirmation, potentially unlocking a move toward 14.65. A sustained break through that level, in turn, would bring the 16‑dollar region into sharp focus as the primary recovery target in the current cycle.