Bitcoin drifts near $86,000 as traders weigh conflicting technical signals
Bitcoin is treading water just below the $86,000 mark, struggling to extend its recent rebound as technical indicators send a murky, often contradictory message. After a mild pullback over the past 24 hours, the leading cryptocurrency remains under its latest peak, holding above nearby support but failing to attract enough buying pressure to spark a fresh breakout.
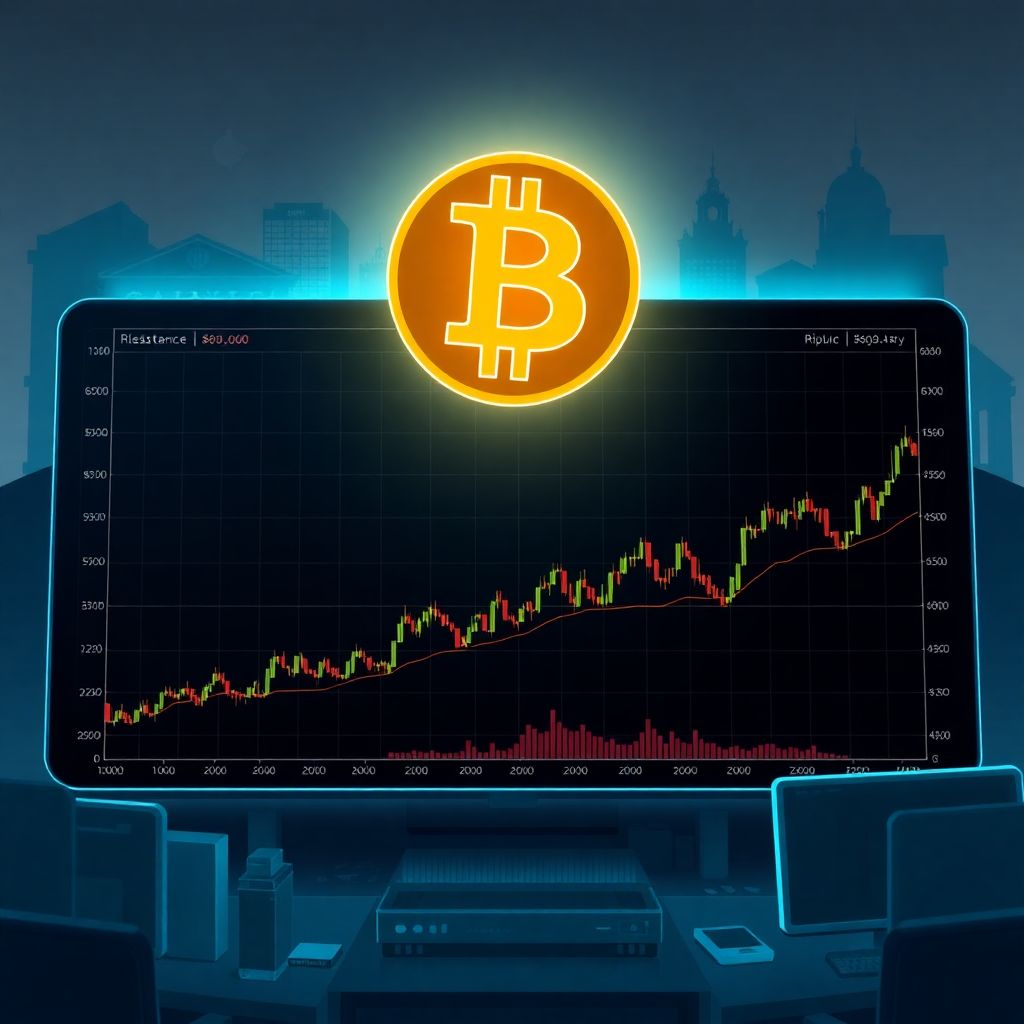
Market data show that Bitcoin (BTC) slipped modestly from recent highs around $86,000 before stabilizing at key psychological price zones late in the week. From there, the asset staged a modest recovery, but the follow‑through has been limited, suggesting that bulls are cautious and sellers are still active around overhead resistance.
The sluggish tone is not limited to Bitcoin. Ethereum (ETH) and Ripple (XRP) kicked off the week with respectable gains, yet their upside momentum has gradually faded. Analysts note that the three major cryptocurrencies are now congregating around critical technical levels where neither buyers nor sellers appear strong enough, for now, to seize clear control of the short‑term trend.
On Bitcoin’s 4‑hour chart, the picture leans slightly bearish. Price has repeatedly tested but failed to clear an important resistance band, signaling that the market is respecting this ceiling as a short‑term barrier. As long as BTC trades below that zone, rallies are likely to be sold into, and intraday traders may continue to favor range‑bound or mildly defensive strategies.
Should the current recovery phase gather steam, technical models suggest that Bitcoin could push toward the next overhead resistance area, which would likely attract renewed profit‑taking and fresh short positions. However, if buyers once again fail to break through, the risk grows that BTC will retreat back toward lower psychological levels that traders watch closely as support. A decisive drop through those thresholds could open the door to a deeper correction.
Momentum indicators add another layer of ambiguity. The Relative Strength Index (RSI) on the 4‑hour timeframe recently dipped below the oversold boundary, then bounced back, signaling that the intense selling pressure seen earlier has eased. This kind of RSI behavior often precedes consolidation phases where the market digests prior moves before choosing a direction.
Meanwhile, the Moving Average Convergence Divergence (MACD) lines are edging closer to the bullish territory. A confirmed bullish crossover would indicate strengthening buying activity and could support a short‑term push higher, especially if accompanied by rising trading volume. At the same time, the lack of a clear break above resistance means these early bullish hints remain tentative rather than decisive.
Beyond short‑term charts, the broader market backdrop is increasingly shaped by institutional dynamics and evolving regulation. Keith Grose, CEO of Coinbase UK, notes that the environment in Europe is shifting as large financial players adopt a more structured, compliant stance on digital assets. According to him, regulatory frameworks are becoming clearer, trading and custody infrastructure is maturing, and early pilot programs are emerging within traditional finance — including a controlled digital‑asset portfolio being tested by the Czech National Bank.
Such developments are significant for Bitcoin’s medium‑ to long‑term trajectory. Institutional pilots and regulated frameworks can help reduce perceived risk, encourage participation from conservative capital, and improve market depth. While these factors do not eliminate volatility, they can gradually transform Bitcoin from a purely speculative instrument into a more integrated component of the broader financial system.
Analysts, looking past the day‑to‑day noise, largely retain a constructive view on Bitcoin’s long‑term potential. Many argue that as regulatory clarity improves and infrastructure scales, the asset could see renewed adoption from asset managers, corporates, and payment providers. However, they stress that the current price action is highly sensitive to whether key support zones hold. A breakdown of those levels could undermine sentiment in the short run and delay any renewed uptrend.
For traders, the current environment demands flexibility. Range trading strategies — buying near support and taking profits near resistance — have generally worked better than aggressive trend following in recent sessions. The failure to break higher, combined with only partial confirmation from RSI and MACD, suggests that chasing rallies carries risk unless accompanied by a clear technical breakout.
Long‑term investors, by contrast, are more likely to focus on the bigger picture: tightening supply dynamics, rising institutional involvement, and Bitcoin’s role as a potential hedge against monetary debasement and macro uncertainty. For this group, short‑term fluctuations around the $86,000 region may matter less than whether the asset maintains its broader upward structure over months and years.
There is also growing attention on how macroeconomic events could intersect with Bitcoin’s current technical setup. Shifts in interest‑rate expectations, inflation data, or signs of stress in traditional markets often spill over into crypto. Periods of heightened risk aversion can push investors to reduce exposure to volatile assets, weighing on BTC. Conversely, renewed liquidity injections or dovish central bank signals may support risk assets, including cryptocurrencies, giving bulls fresh ammunition to challenge resistance.
Another factor worth watching is market positioning and leverage in derivatives markets. Elevated leverage can intensify sharp moves in either direction, as liquidations cascade when prices breach key levels. If Bitcoin continues to stall under resistance while leveraged long positions build up, the market becomes vulnerable to a sudden downside flush. On the other hand, if leverage remains contained and spot buying grows, it could provide a healthier base for a sustained advance.
Sentiment indicators, options pricing, and on‑chain metrics may help clarify this stand‑off over the coming days. Rising open interest alongside neutral or moderately positive funding rates might signal cautious optimism, whereas extreme positioning could warn of an impending shake‑out. On‑chain data such as realized profits and losses, long‑term holder activity, and exchange flows can provide additional clues about whether current price levels are being treated as an opportunity to accumulate or to offload holdings.
In essence, Bitcoin’s pause around $86,000 reflects a market in transition. Short‑term charts show unresolved tension between modest bullish signals and persistent resistance, while longer‑term themes — regulatory evolution, institutional experimentation, and infrastructure growth — continue to underpin a generally positive outlook. Until price either convincingly breaks above resistance or loses key support, traders may have to navigate a choppy, directionless phase where discipline and risk management matter more than bold predictions.
For now, the path of least resistance remains uncertain. Bulls need a strong, high‑volume push through overhead barriers to reassert control, while bears will look for signs of exhaustion near current levels to drive the price back toward lower supports. How this balance resolves will likely determine whether Bitcoin’s next major move is a renewed leg higher or a more pronounced correction from the $86,000 range.