XRP trades under pivotal 50‑week SMA as analysts revisit past rally blueprints
Ripple’s native token is once again hovering beneath a key long‑term indicator, prompting market watchers to dig into historical price behavior in search of clues about what might come next.
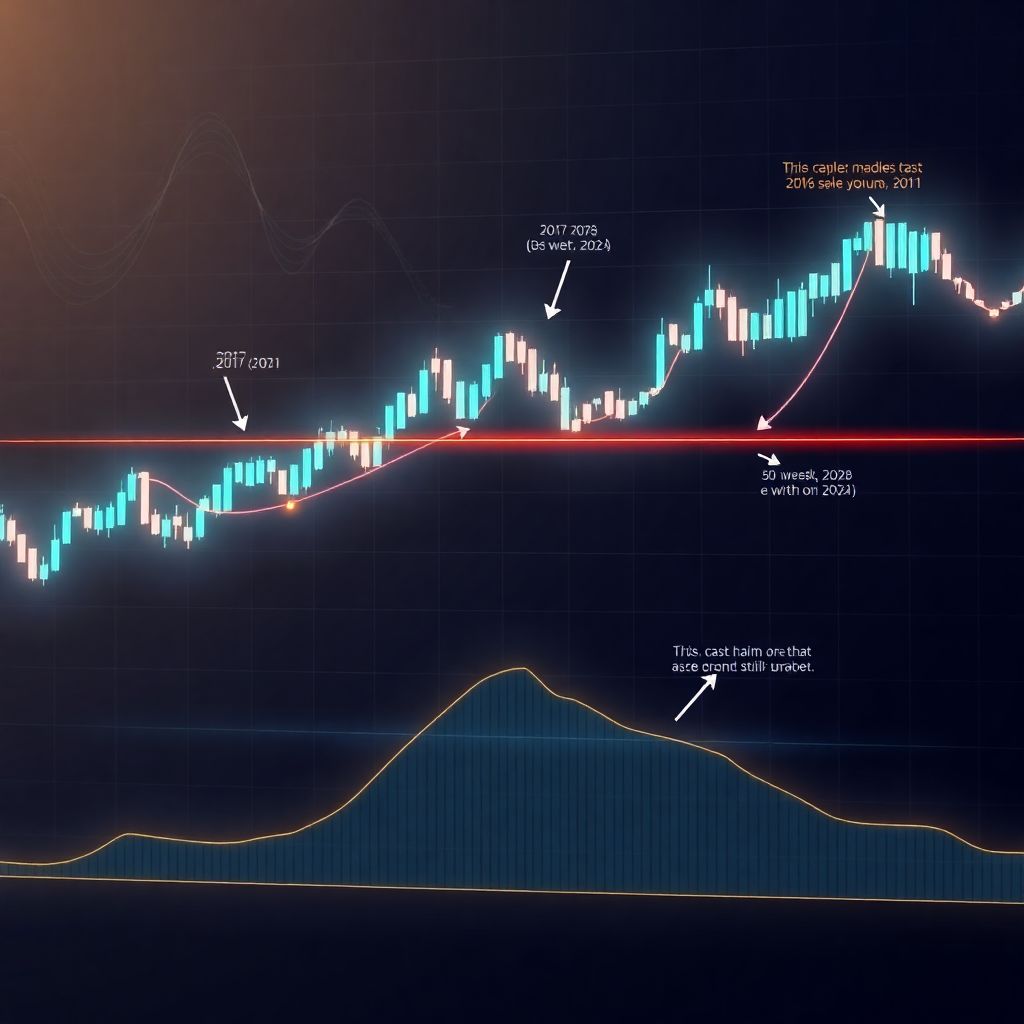
According to several cryptocurrency analysts, XRP has now spent roughly 70 consecutive days below its 50‑week Simple Moving Average (SMA) – a threshold that has preceded sizeable rallies in previous market cycles. While there is no confirmation of a breakout yet, the duration and structure of the current consolidation are drawing comparisons to earlier phases that came before steep upside moves.
Historical pattern: days below the 50‑week SMA before rallies
Analyst Steph Is Crypto has mapped out XRP’s performance relative to the 50‑week SMA across several past cycles. In each instance, a multi‑week period spent below this moving average was followed by a substantial price advance:
– In 2017, XRP traded under the 50‑week SMA for around 70 days, then climbed by more than 200%.
– In 2021, the token spent about 49 days under the same level before posting a gain of roughly 70%.
– In 2024, after remaining below the 50‑week SMA for 84 days, XRP surged by more than 850%.
Now, the asset has once again completed a 70‑day stretch below this long‑term average. While that alone does not guarantee a repeat of previous rallies, it reinforces the perception that prolonged sub‑SMA phases tend to coincide with late‑cycle accumulation and suppressed volatility before more decisive trends emerge.
Three‑wave correction and sideways consolidation
Beyond the SMA signal, Steph Is Crypto also notes that XRP’s current 2025 chart structure resembles patterns observed in 2016 and 2024. In both of those years, the token formed a three‑wave corrective sequence that lasted between 120 and 150 days. These correction phases were characterized by:
– Choppy sideways price action
– Compressed volatility
– Declining trading volume
Only after this extended consolidation did the market transition into a more aggressive upside move.
The present 2025 pattern has now reached the upper end of that historical duration, around 150 days, and shows similar hallmarks of range‑bound trading and muted interest. For technically oriented traders, this resemblance suggests that XRP may be approaching an inflection point, where either a breakout materializes or the historical pattern fails.
Fractal model suggests path‑dependent scenarios
Another technical perspective comes from analyst Egrag Crypto, who has developed a fractal model designed to mirror XRP’s recurring price behavior across cycles. According to the analyst’s own assessment, this model currently tracks XRP with an accuracy of roughly 82%, though it is presented as an evolving framework rather than a prediction tool.
The fractal defines a band of potential future price paths. As long as XRP’s spot price stays within that band, the model remains “in play,” hinting that the asset is broadly respecting familiar cyclical tendencies. However, a sustained move below certain lower thresholds would weaken or invalidate the scenario, signaling that the market has diverged from the historical blueprint.
Within this context, Egrag outlines a window between mid‑2026 and late 2026 – roughly June to October – as a plausible period for a more pronounced price expansion, assuming the fractal structure continues to hold. That does not exclude earlier price moves, but it places the most aggressive upside potential in a medium‑term time frame rather than the immediate months ahead.
Short‑term structure: key levels for bulls and bears
While longer‑term models focus on weekly and multi‑year dynamics, other analysts are watching nearer‑term levels that could determine XRP’s next directional move. Analyst CryptoWZRD, for example, highlights a specific price zone that needs to hold for XRP to remain in a technically bullish posture.
In this view, staying above a defined support area keeps the door open for a gradual grind higher and a potential challenge of overhead resistance. A daily or weekly close below that line in the sand, by contrast, would likely extend the current sideways range and introduce more erratic price swings without a clear trend.
This assessment aligns with the observation that Bitcoin currently dominates broader market sentiment. As long as BTC’s direction sets the tone, XRP may struggle to establish an independent trajectory, resulting in indecisive closes and range‑bound conditions until a catalyst appears.
Downside risk: warning signs of a deeper correction
Not all analysts are focused on the bullish historical setup. Market strategist Ali Martinez has flagged what he sees as a tangible risk of a sharper pullback if critical supports fail to hold.
Based on a combination of technical indicators and key resistance rejections, Martinez cautions that XRP could be vulnerable to a drop of more than 55% from current levels in a bearish scenario. The logic is straightforward:
– Multiple failed attempts to break through resistance zones can signal exhaustion among buyers.
– If sellers gain control and drive the price below major supports, stop‑loss orders and liquidations may amplify the move.
– In that case, a slide toward the 0.80 dollar region becomes a plausible target on the chart.
This risk‑averse perspective underscores that while historical rally patterns are compelling, they do not eliminate the possibility of deeper corrections, especially in a market prone to sudden shifts in liquidity and sentiment.
Exchange flows and market structure: Binance in focus
On the market microstructure side, recent data indicates that Binance accounts for the largest share of XRP’s trading volume. When a single platform concentrates a significant portion of activity, its order books and internal flows can have an outsized influence on intraday price behavior.
Observers often interpret rising inflows of XRP to exchanges as a potential signal that holders are positioning to sell, particularly if these inflows coincide with resistance tests or broader risk‑off sentiment in crypto. Conversely, declining exchange balances or increasing outflows to self‑custody are sometimes seen as a sign of accumulation and reduced immediate sell pressure.
In the current environment, traders are keeping a close eye on whether increased volume on major exchanges represents speculative positioning ahead of a breakout or the early stages of distribution before a deeper pullback.
How traders might interpret the 50‑week SMA signal
The repeated pattern of XRP trading below the 50‑week SMA before significant rallies tempts many to treat this level as a near‑mechanical buy signal. However, experienced market participants typically use it as one piece of a broader toolkit rather than a stand‑alone trigger.
Potential interpretations include:
– Cycle timing tool: A prolonged stay below the 50‑week SMA suggests that a corrective phase is well underway and may be closer to exhaustion, particularly if accompanied by low volume and waning volatility.
– Risk management reference: Traders may use the SMA as a dynamic line separating long‑term bullish and bearish regimes, adjusting position size or hedging strategies when price trades above or below it.
– Confluence indicator: When the 50‑week SMA aligns with horizontal support or resistance levels, trend lines, or Fibonacci zones, it can gain added importance as a decision point.
Crucially, because historical percentage gains (such as +850% in 2024) are outliers rather than norms, responsible analysis emphasizes probability and risk scenarios rather than repeating raw performance figures as expectations.
What could invalidate the bullish historical setup?
Several factors could undermine the bullish narrative built around fractals and SMA patterns:
1. Decisive breakdown below major supports: If XRP slices through multi‑month support zones with strong volume, it would challenge the notion that the current phase is merely a consolidation before upside continuation.
2. Structural change in liquidity: A sharp drop in overall trading volume, or shifts in market depth on key exchanges, could reduce the reliability of past price relationships.
3. Macro shocks: Sudden regulatory, macroeconomic, or cross‑market events can override chart structures and render historical correlations less predictive.
4. Failure to reclaim the 50‑week SMA: If XRP repeatedly tests but fails to close back above the 50‑week SMA over an extended period, it may signal a longer‑lasting bearish regime than in earlier cycles.
These invalidation points are central for systematic traders who rely on rule‑based approaches. Once a model’s premises are broken, they aim to exit or adjust rather than hoping for a reversion to previous patterns.
Long‑term narrative vs. short‑term volatility
The diversity of analyst views around XRP highlights a key tension in crypto investing: the clash between long‑term narratives and short‑term noise. On one hand, historical cycles suggest that extended periods below the 50‑week SMA and three‑wave corrections can precede outsized rallies. On the other, the market remains highly sensitive to short‑term liquidity, regulatory headlines, and Bitcoin’s leadership.
For long‑term holders, the current setup may look like a familiar late‑cycle accumulation phase, with subdued price action potentially masking underlying structural positioning. For short‑term traders, however, the same range‑bound environment can be a source of frustration, marked by false breakouts, abrupt reversals, and limited follow‑through in either direction.
Balancing these perspectives often means:
– Treating long‑term patterns (like fractals and weekly SMAs) as context, not as trade triggers.
– Using clearly defined support and resistance zones to manage entries and exits.
– Recognizing that historical analogues inform probabilities but never guarantee outcomes.
Outlook: compressed spring or prolonged stasis?
As XRP lingers below its 50‑week SMA, the market sits at a crossroads. If past cycles are any guide, the combination of extended consolidation, three‑wave corrective structures, and historical SMA behavior could be the prelude to a renewed trend, potentially unfolding over the next one to two years.
However, the presence of credible downside scenarios – including a possible drop toward 0.80 dollars if support fails – means market participants are approaching the current range with caution. Whether this phase ultimately resolves into a powerful breakout or a deeper reset will likely depend on a mixture of technical triggers, macro conditions, and shifts in broader crypto risk appetite.
For now, analysts largely agree on one point: XRP is in a technically significant zone where patience, disciplined risk management, and an understanding of historical context may matter more than ever.