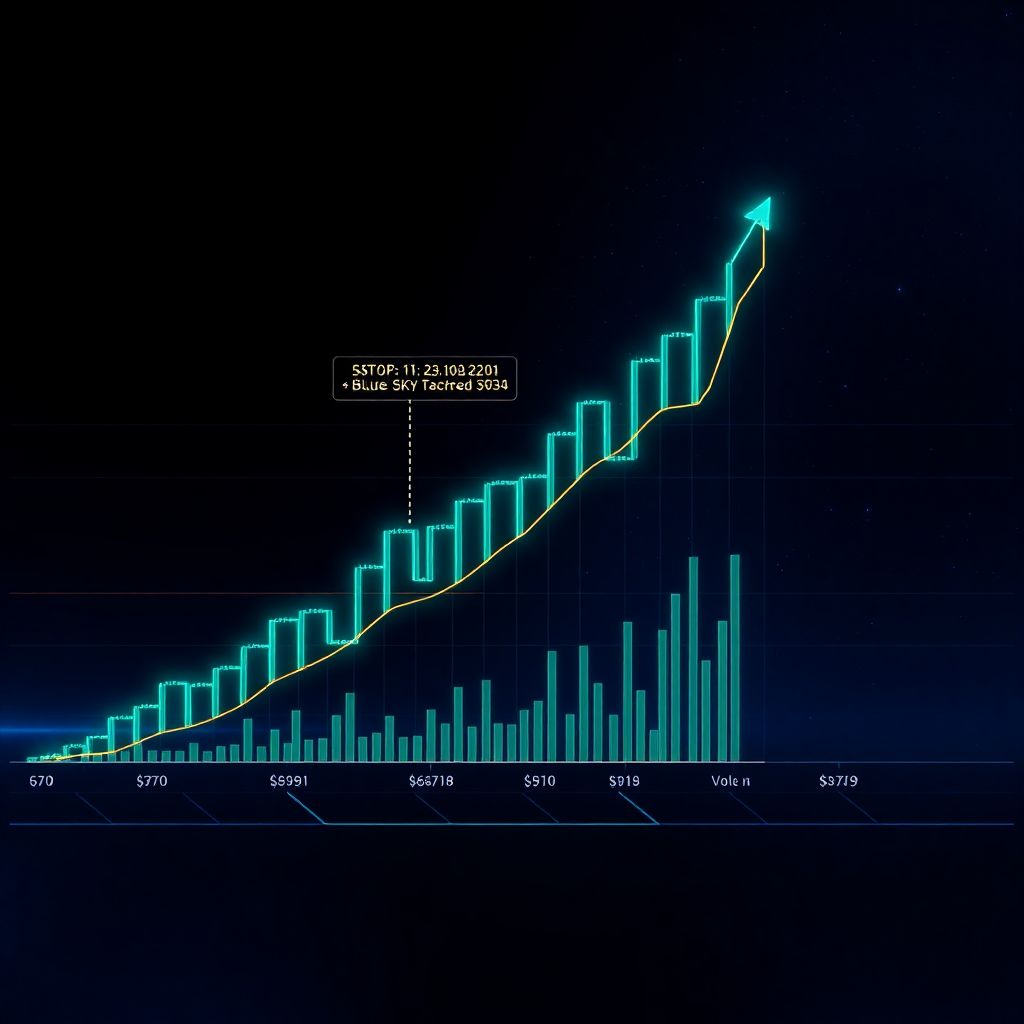
Monero price is still pushing higher in a classic blue‑sky breakout, with the market now looking toward the $930–$939 zone as the next major Fibonacci extension target. After reclaiming and firmly holding above the $670 extension level, bullish momentum remains intact, keeping the path of least resistance tilted to the upside.
Key technical takeaways for Monero (XMR)
– Reclaiming $670 confirms sustained acceptance above the 0.618 Fibonacci extension
– The next significant Fibonacci target sits in the $930–$939 region (2.618 extension)
– Strong volume inflows are validating the breakout and supporting trend continuation
– Blue‑sky conditions limit overhead resistance, allowing price to move more freely
– As long as daily closes hold above key support, upside continuation remains the favored scenario
Blue‑sky breakout: what it means for XMR
Monero is currently trading in what technicians call a blue‑sky breakout: price has moved into territory where there is little or no recent historical congestion, meaning fewer well‑defined resistance zones overhead. In such an environment, markets often advance quickly because there are not many pre‑existing sell orders or large supply pockets at these newly explored price levels.
This kind of structure is typically characterized by two elements: persistent upside momentum and a lack of strong resistance clusters above price. Once an asset breaks out and starts to explore higher ground, the absence of clear overhead barriers often causes the rally to extend farther than many participants initially expect.
For XMR, this dynamic is clearly in play. Each time the market has reached an important Fibonacci extension, price has briefly paused, consolidated, and then resumed higher once traders accepted that level as the new normal. This pattern of “tag, pause, accept, continue” is a hallmark of a healthy continuation trend.
Role of Fibonacci extensions in the current rally
With Monero trading into relatively uncharted territory, Fibonacci extensions become crucial guideposts. When there is limited historical price data to define resistance, traders frequently rely on Fibonacci projections drawn from prior impulse waves to outline probable upside targets and potential pause zones.
The 0.618 extension – corresponding to the $670 area – was the first major hurdle in this breakout sequence. Once that level was reached, XMR did not reverse aggressively or show signs of exhaustion. Instead, the market entered a brief consolidation phase, allowing overextended intraday moves to cool off while buyers continued to step in on dips.
The important technical milestone is that Monero has now closed above $670 on multiple daily candles. Those repeated daily closes indicate that the market has fully accepted this region, not just as a temporary spike level but as a structurally significant support zone. That acceptance significantly raises the likelihood that the breakout is durable rather than a short‑lived squeeze.
$670 flips from resistance to support
Turning a major extension level into a support floor is a critical part of sustaining any breakout. By maintaining daily closes above $670, XMR has effectively flipped this prior resistance into a new base for the ongoing uptrend.
This structural shift carries two main implications:
1. Dips back toward $670 are more likely to attract buyers than trigger panic selling, as traders now view this level as a buy‑the‑dip zone aligned with the broader bullish structure.
2. The probability of a full reversion into the previous range decreases, because the market has accepted higher prices as fair value, at least in the current stage of the trend.
As long as price continues to respect this newly formed support, the path remains open for further rallies toward the next Fibonacci objectives.
Next upside magnet: $930–$939 Fibonacci target
With the $670 extension now reclaimed and defended, attention shifts to the $930–$939 region, where the 2.618 Fibonacci extension is located. In strong trending environments, such higher‑order extensions often function as magnets, drawing price toward them as long as momentum and participation remain supportive.
The distance between $670 and $930 is substantial, but in blue‑sky conditions, markets can traverse such ranges more quickly than usual. Without dense resistance clusters overhead, price is not forced into prolonged choppy ranges and can advance in cleaner, more directional moves.
The $930–$939 zone is therefore a logical next checkpoint for traders. It is a likely area where some profit‑taking could emerge, and where the market may again pause to decide whether to consolidate, correct, or extend even further.
Volume as a validation tool for the breakout
Volume is one of the most important confirming indicators in any breakout environment. Sustained or rising volume during impulsive upswings generally indicates genuine demand rather than a thin, easily reversible rally.
In Monero’s case, the breakout has been underpinned by solid volume inflows. Buying activity has expanded during the strongest legs higher and remained constructive during consolidations. This pattern suggests that market participants are not merely chasing short‑term spikes, but are willing to engage at successively higher price levels.
Healthy volume during expansion phases reduces the risk of a “fakeout” breakout that quickly fails and reverses. If strong volume persists as XMR pushes closer to the $930–$939 region, it would reinforce the current bullish narrative and support the view that higher Fibonacci targets remain attainable.
What to watch in upcoming price action
In the short to medium term, several signals will be crucial for gauging whether the uptrend retains its strength:
– Daily closes above $670: Continued acceptance above this level confirms that the breakout structure is intact. A decisive breakdown below on strong volume would be an early warning that momentum is fading.
– Behavior near interim resistance zones: Even in blue‑sky conditions, intraday or minor swing highs can form. How price reacts to these smaller hurdles can offer clues about buyer strength.
– Price reaction approaching $930–$939: A brief pullback or sideways consolidation just below this region would be normal. Sharp, high‑volume rejection, however, could signal exhaustion and a potential trend pause.
– Volume trends: Declining volume during new highs could indicate waning participation, while consistent or growing volume would support the case for continued advance.
Short consolidations or shallow pullbacks below $930 should be viewed as part of normal trend mechanics rather than immediate signs of reversal, provided the broader structure of higher highs and higher lows remains intact.
Potential bullish and bearish scenarios from here
From a scenario‑planning standpoint, the current structure tilts bullish, but traders should keep both sides of the coin in view:
– Bullish continuation scenario: XMR maintains daily closes above $670, grinds higher with healthy volume, and eventually tags the $930–$939 extension. After a period of consolidation or mild profit‑taking at that zone, buyers step back in, and the market begins targeting even higher extensions.
– Constructive pullback scenario: Price temporarily loses momentum before reaching $930, dips back toward the $670–$700 area, finds buyers, and establishes a broader range. This would reset overextended oscillators and could lay the groundwork for a more sustainable advance later.
– Bearish breakdown scenario: XMR loses $670 on strong selling pressure, with follow‑through to the downside and no quick recovery. In that case, the breakout thesis would be weakened, and the market could revert toward prior consolidation zones to search for a more solid base.
At present, the first two scenarios remain more consistent with the existing data, chiefly because volume and price structure still favor the bulls.
Risk management considerations for traders
For participants actively trading this move, the current environment offers opportunity but also elevated volatility risk:
– Chasing at extremes: Entering positions far above reclaimed support without a clear plan can expose traders to sharp intraday reversals, especially near key extension targets where profit‑taking becomes more likely.
– Defining invalidation levels: Using areas like $670 as structural reference points helps define when the breakout thesis is compromised, guiding stop‑loss placement and position sizing.
– Monitoring volatility: As price travels in a blue‑sky breakout, daily ranges can widen. This can quickly magnify both profits and losses, making disciplined risk control essential.
Traders who align their strategies with the larger trend but remain prepared for pullbacks and shakeouts are typically better positioned than those relying solely on short‑term noise.
Broader context: why Monero’s structure stands out
Beyond the immediate breakout, XMR’s technical behavior highlights a broader point: markets tend to reward assets that can reclaim and hold key levels on higher timeframes. Multiple daily closes above an important Fibonacci extension do more than just push price higher; they reshape the long‑term chart by converting old resistance into new demand zones.
This process gradually builds a staircase of higher supports, creating a more robust foundation for any future uptrend. If Monero continues to repeat this sequence at subsequent extensions, it will not only validate the current rally but also improve the long‑term bullish structure of the asset.
Outlook: bias remains higher toward $930–$939
Monero remains in a technically robust breakout, with momentum tilted upward, $670 acting as reclaimed support, and the $930–$939 Fibonacci extension emerging as the next logical upside objective. As long as daily closes hold above the key reclaimed levels and volume stays constructive, the probability continues to favor an eventual test of that target zone.
In the near term, the critical question is not whether minor pullbacks will occur, but whether the broader breakout structure persists without deep and persistent rejection. Short pauses, consolidations, or modest corrections are a normal part of an advancing market. Sustained acceptance at higher levels and strong follow‑through after such pauses would confirm that the breakout remains active and that buyers are still firmly in control.