Hyperliquid price grinds lower as bearish structure targets $19.75
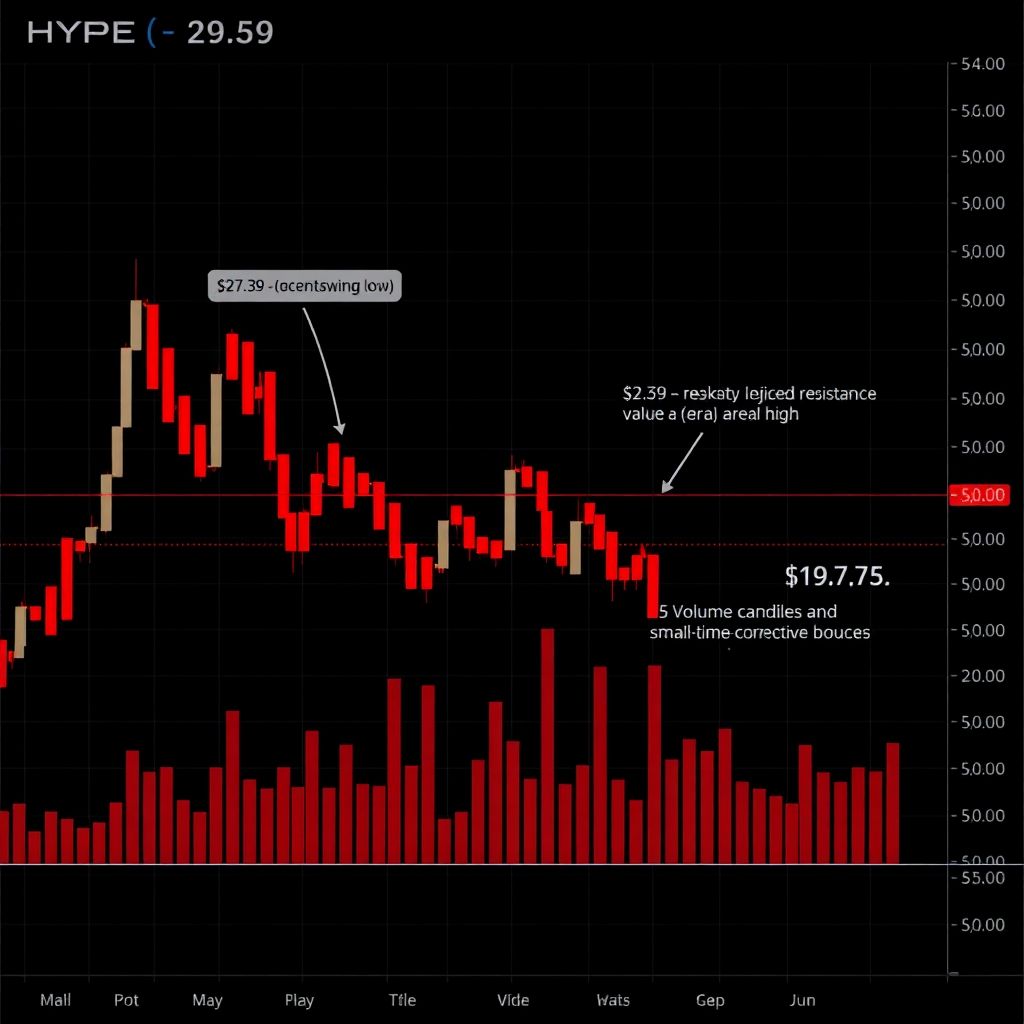
Hyperliquid (HYPE) continues to trade under clear downside pressure, with the chart locked in a firmly bearish structure. After failing to break and hold above the key resistance zone at $27.39, price action has been carving out a sequence of lower highs and lower lows, confirming that sellers are still dictating the trend and that further downside remains the path of least resistance.
The rejection from $27.39 did more than just halt a short-term rally – it acted as a structural pivot. That level aligned with the value area high on higher time frames, a region that typically separates discounted prices from premium territory. When an asset cannot reclaim and defend this area, it often signals that the market is not ready to sustain higher valuations. In Hyperliquid’s case, the failed attempt above $27.39 marked the start of an accelerated move lower back into the prior value zone.
Why the $27.39 rejection matters
In strong trending markets, a decisive break and hold above the value area high frequently opens the door to trend expansion, as new buyers step in and shorts begin to cover. The opposite scenario is now playing out in HYPE:
– Price briefly pushed into the $27.39 resistance zone.
– Buyers were unable to keep price above this premium level.
– Sellers stepped in aggressively, defending resistance and rejecting the breakout.
– Price rotated lower, slipping back below key value levels and reinforcing the existing downtrend.
This pattern – a failed breakout at resistance followed by renewed selling – is textbook bearish market behavior. It signals that demand at higher prices is weak, that liquidity is thin on the offer side, and that bears are comfortable adding to positions when price tests overhead supply.
Market structure still favors the bears
The dominant feature of the current Hyperliquid chart is the consistent formation of:
– Lower highs
– Lower lows
– Failed rallies at resistance zones
As long as this pattern persists, the market structure remains unambiguously bearish. Even if short-lived bounces appear, they will be treated as corrective rallies within a broader downtrend unless they are strong enough to break the pattern and establish a series of higher lows and higher highs.
For now, the technical picture shows no confirmed shift in structure. Attempts to push higher are repeatedly absorbed near resistance, and each subsequent high is being set at a lower level than the previous one. This steady compression from above suggests that sellers are systematically stepping down their offers and controlling the auction.
$22 and $19.75: critical downside levels
On the downside, the $22 region has emerged as the next immediate level of interest. It represents a recent swing low and a short-term line in the sand for intraday and swing traders. A clean breakdown and acceptance below $22 would further validate the bearish structure and likely accelerate selling pressure.
Below $22, the next major target stands at $19.75. This zone is not just another intraday support – it marks an important high-time-frame demand area and the lower boundary of a broader trading range that has defined Hyperliquid’s market over a longer horizon. Because of its higher time-frame significance, price action around $19.75 is expected to be particularly meaningful.
High-time-frame support levels often trigger at least a temporary reaction, even in strong downtrends. As price approaches these zones, short sellers may begin to take profits, while opportunistic buyers look for signs of exhaustion or oversold conditions to initiate speculative longs. This dynamic can lead to sharp but potentially short-lived bounces.
Possible scenarios around the $19.75 support
Traders should be prepared for two main scenarios if price reaches the $19.75 area:
1. Bounce and range preservation
– If buyers respond aggressively at $19.75, a rebound could signal that the broader range is still being respected.
– In this case, HYPE may attempt to stabilize, forming a local base that could support a move back toward mid-range levels.
– Such a reaction would not automatically reverse the trend but could create a consolidation phase before the next decisive move.
2. Breakdown and structural failure
– If selling pressure remains intense and volume expands on a move through $19.75, this would point to a failure of high-time-frame support.
– A confirmed breakdown below this level would mark a deeper structural deterioration, increasing the risk of a more extended bearish expansion.
– Traders would then begin to look for lower untested demand zones, as prior support turns into new resistance on any subsequent rallies.
The way price behaves at $19.75 will likely set the tone for the next medium-term leg: either a period of sideways repair and attempted stabilization, or another wave of downside continuation.
What bulls need to invalidate the bearish view
For any credible bullish reversal narrative to take shape, Hyperliquid must do more than just bounce from support. A structural shift would require:
– Reclaiming and holding above key resistance zones (first local, then higher-time-frame).
– Breaking the current pattern of lower highs by establishing at least one clear higher high.
– Building a series of higher lows that signal sustained demand and accumulation rather than short-covering alone.
Without this structural flip, rallies are more likely to be treated as relief moves inside a dominant downtrend. Short sellers typically use such rallies to re-enter at better prices, which can cap upside and keep the pressure pointed lower.
How traders may approach the current setup
Given the prevailing structure, many traders will view the chart through a risk-first lens:
– Trend-following bears may continue to favor short setups while price remains below resistance and under the value area high, targeting $22 first and then the $19.75 zone if breakdowns confirm.
– Range and mean-reversion traders might watch $19.75 closely for signs of exhaustion or a bounce, using it as a potential area for speculative long entries with tight risk controls.
– Neutral observers may prefer to wait for clearer confirmation – either a decisive breakdown below $19.75 or a convincing structural recovery – before committing capital.
In all cases, the focus remains on structure rather than single candles: one strong move up or down is less important than whether the sequence of highs and lows genuinely changes.
Volume, liquidity, and momentum considerations
Beyond price levels, traders will be watching volume and liquidity conditions carefully:
– Expanding volume on breakdowns typically confirms that participants are actively participating in the move, increasing the probability of follow-through.
– Weak volume on bounces from support may indicate that rallies are driven more by short covering than by fresh, committed buying.
– Thin liquidity near key levels can result in sharp wicks and stop-runs, especially around $22 and $19.75, where many traders are likely to cluster orders.
If bearish momentum accelerates alongside rising volume into $22 and $19.75, that would favor continuation. Conversely, slowing momentum, divergence on oscillators, or repeated failures by sellers to push price to fresh lows could foreshadow a potential exhaustion phase.
Short-term vs. high-time-frame signals
A common trap in environments like this is overreacting to short-term countertrend moves. Intraday charts may show sharp rallies that look strong in isolation but fail to alter the bigger picture. High-time-frame traders will be paying more attention to:
– Daily and weekly closes relative to $22 and $19.75.
– Whether candles show long lower wicks (sign of dip-buying) or strong-bodied closes near the lows (sign of persistent selling).
– The durability of any bounce – whether it holds for several sessions or is quickly faded.
If Hyperliquid repeatedly closes below former support levels and struggles to reclaim them, the message from the high-time-frame structure remains bearish, regardless of shorter-term volatility.
Risk management in a bearish environment
In a market leaning heavily to the downside, risk management becomes as important as direction. Traders may consider:
– Reducing position sizes as price approaches major inflection points like $19.75.
– Using clearly defined invalidation levels above recent swing highs when trading short.
– Avoiding the temptation to “catch the absolute bottom” without evidence of stabilization or a shift in structure.
Volatility around high-time-frame levels can be extreme, and failed breakdowns or fakeouts are common. Planning trades around scenarios rather than predictions helps mitigate the emotional impact of sudden moves.
Outlook: bias remains to the downside unless structure flips
Hyperliquid remains in a confirmed bearish trend as long as price is capped below resistance and trades under the value area high. The immediate focus is on the $22 swing low, with a sustained break there likely to open the path toward the $19.75 high-time-frame support zone.
Until HYPE can reclaim key resistance levels and meaningfully disrupt the pattern of lower highs and lower lows, sellers maintain the advantage and downside targets remain active. Any temporary stabilization or bounce should be evaluated through the lens of whether it changes the underlying structure – not just whether it produces a short-lived rally.
For now, the market continues to lean lower, and the $19.75 level stands out as the next major battleground between bulls seeking to defend the range and bears attempting to drive the trend into a deeper bearish expansion.