Ethereum price is increasingly compressed inside a maturing triangle pattern, with the market coiling toward the apex where a decisive move is becoming unavoidable. As volatility contracts and trading activity clusters around key value levels, the stage is being set for a breakout that could trigger a strong expansion phase—provided it is supported by convincing volume and clear acceptance outside the current range.
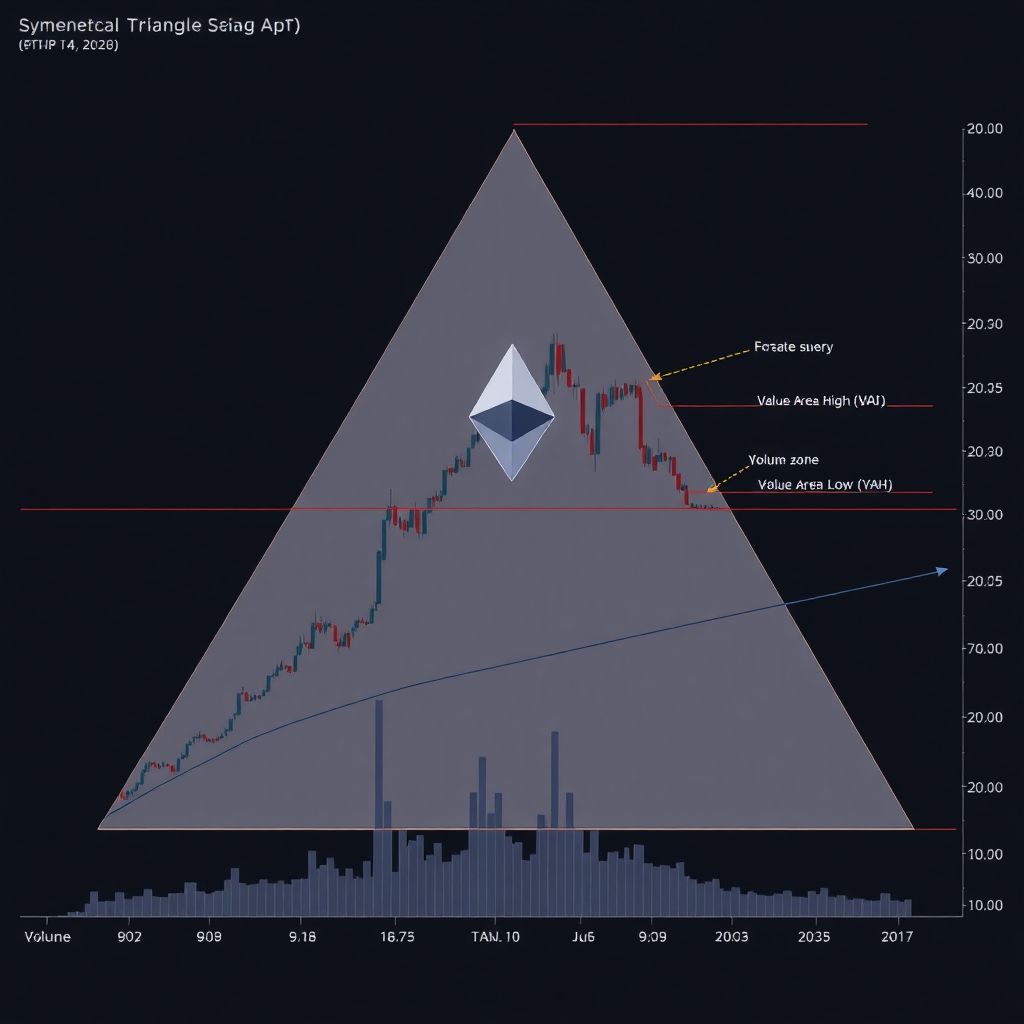
Over the past several weeks, ETH has been carving out a series of lower highs and higher lows, forming a classic symmetrical triangle. This pattern does not inherently signal bullish or bearish bias; instead, it reflects a state of balance and indecision. Buyers are no longer able to push price to fresh highs, while sellers fail to drive it to new lows. The result is a tightening range where each swing is narrower than the last, compressing price into a zone where equilibrium cannot persist indefinitely.
This type of volatility compression is often a precursor to an explosive directional move. Markets rarely stay quiet for long—periods of calm tend to be followed by phases of expansion, where price rapidly seeks a new area of value. For Ethereum, the current consolidation is taking place within a broader range on the higher time frames, meaning the triangle serves as a pause or congestion area rather than a confirmed trend reversal by itself.
A crucial technical element in this structure is Ethereum’s behavior around the Point of Control (POC)—the price level that has attracted the most trading volume within the recent range. When price hovers near the POC, it signals balance between buyers and sellers, with neither side showing clear dominance. This equilibrium, however, rarely lasts. Once the market decides whether it prefers to transact above or below this level, a strong rotation often follows as participants reposition around a new perceived fair value.
Currently, as the triangle’s support and resistance lines converge, price has less and less room to move without confronting one of these boundaries. The narrower the range becomes, the more likely it is that even a modest influx of new orders will be enough to force a breakout. What truly matters at this point is not just that price breaks the pattern, but whether the move attracts sustained participation.
On the upside, a bullish scenario would be defined by a clean, decisive close above the triangle’s resistance line. Ideally, this would be accompanied by a visible expansion in volume, indicating that buyers are stepping in with conviction rather than simply triggering a few stops. Without this surge in participation, many upside breakouts prove to be “fakeouts”: price briefly jumps above resistance, lures in breakout traders, and then swiftly reverses back into the range, inflicting losses on late buyers.
From the bearish perspective, a confirmed break below triangle support would imply that the market is accepting prices beneath the current value zone. Such a move would likely increase the odds of a rotation toward the Value Area Low (VAL)—a key level where previous trading activity diminished and liquidity thins out. After failed consolidations, markets often gravitate toward these lower liquidity pockets to rebalance order flow, flushing out weak hands and testing the resolve of longer-term holders.
Across both scenarios, volume remains the key filter. A breakout occurring on muted trading activity is statistically more vulnerable to failure and subsequent reversion to the mean. By contrast, when a breakout is backed by strong volume and follow-through, it suggests that one side of the market has finally seized control, initiating a genuine expansion rather than a short-lived spike.
On the larger time frame, Ethereum’s price action still fits within a broad range structure. Neither the upper boundary of the value area (the Value Area High, or VAH) nor the lower boundary (the VAL) has been definitively broken and accepted. The triangle, therefore, should be understood as a consolidation pattern inside this overarching sideways environment. Until ETH can secure sustained trading above the VAH or below the VAL, the default expectation remains one of rotation—price moving back and forth between key value levels rather than trending in a single direction.
Liquidity dynamics play a significant role in what happens after the breakout. Once ETH escapes the confines of the triangle, price is statistically likely to be drawn toward the next major volume node or value area boundary. If the breakout is upward and accepted above the POC, the VAH becomes a natural magnet as traders and algorithms target the next area where heavy participation previously occurred. If the breakout is downward, the VAL takes on that role, potentially acting first as a target and then as a decision point: either as support where buyers step in, or as a launchpad for further downside if it fails.
For traders, the proximity to the triangle apex implies that the risk-reward profile is shifting. Entering positions inside the pattern can be attractive due to tighter stop-loss placements, but it also demands discipline and patience. Aggressive participants may look to pre-position near support or resistance with clearly defined invalidation levels, while more conservative traders often choose to wait for confirmation: a breakout, a retest of the broken level, and then evidence of continuation.
Risk management is especially critical during these phases. False breakouts are common near key technical structures, particularly when overall market liquidity is thin or when broader macro sentiment is uncertain. Traders may consider scaling into positions rather than going all-in on the first sign of a move, using volume, candle structure, and reaction at nearby support or resistance levels as additional confirmation tools.
Beyond pure chart structure, it is also worth considering the broader context. Triangle formations often appear ahead of significant catalysts—whether upcoming network upgrades, macroeconomic data, shifts in risk appetite across asset classes, or sector-specific narratives. While the current pattern reflects technical indecision, any major fundamental development could act as the trigger that resolves the stalemate and propels ETH out of its compression zone.
Longer-term investors may view this consolidation differently than short-term traders. For those focused on multi-month or multi-year horizons, ranges and triangles can be seen as phases where the market digests prior moves, builds a new base of holders, and redistributes coins between strong and weak hands. From that perspective, what matters more is where Ethereum ultimately establishes acceptance: whether it can sustain above key value levels and build support on higher ground, or whether it sinks back toward lower ranges, offering new accumulation opportunities but delaying any larger uptrend.
An additional layer of nuance lies in monitoring how other major cryptocurrencies behave as Ethereum approaches its breakout point. If ETH attempts to break higher while the broader market is under pressure, the move may struggle to gain traction. Conversely, if Bitcoin and other large-cap assets are also breaking out or showing strong momentum, a bullish resolution of the triangle is more likely to see follow-through. Correlations can amplify or dampen individual setups, and ETH is no exception.
From a psychological standpoint, compression patterns like this triangle tend to build tension among market participants. As price oscillations shrink, traders become increasingly aware that a decisive move is coming, but uncertainty over direction can lead to reduced participation and cautious positioning. When the breakout finally occurs, this pent-up energy often manifests in rapid, large candles as sidelined traders rush to join the new trend or exit losing positions.
As Ethereum moves deeper into the apex of its triangle, the probability of a volatility expansion grows. A breakout supported by strong volume and evidence of acceptance beyond the immediate pattern could mark the start of a new directional phase, targeting the next major value area on the chart. In the absence of such confirmation, however, market participants should remain alert to the risk of choppy, range-bound conditions and deceptive moves around key levels.
Until a clear, high-volume break is recorded—either above resistance with follow-through toward the upper value zones or below support with rotation toward the lower ones—Ethereum is likely to continue hovering near the Point of Control. In this environment, the interplay between volume, liquidity, and acceptance around key technical thresholds will determine whether the next chapter is defined by genuine expansion or yet another round of rotation within the broader range.