Ethereum Liquidity Clusters Put $1,900 And $1,600 Back In The Spotlight
Ethereum traders are laser‑focused on two key zones on the chart as large liquidity clusters have formed around $1,900 on the upside and $1,600 on the downside. According to market analyst Ted Pillows, the distribution of liquidation levels is now relatively balanced between these areas, creating a tight battlefield for both bulls and bears.
With ETH currently trading in the mid‑range between those levels, the market does not need a dramatic move to trigger a wave of forced liquidations in either direction. That makes the next decisive push – whether higher toward $1,900 or lower toward $1,600 – especially important for short‑term direction.
Why Balanced Liquidity Can Be Risky
Liquidity clusters form where many leveraged traders have placed their stop‑losses and liquidation levels. When these clusters are heavily concentrated above or below the current price, they act like a magnet, often giving the market a clear bias.
In the current environment, however, liquidity is stacked on both sides. This symmetry removes the “obvious” path of least resistance and creates a more dangerous setup. Price can whip sharply up or down with relatively small catalysts, as liquidity hunts become attractive for large players who want to flush out over‑leveraged positions.
Balanced liquidity often leads to:
– Sudden volatility spikes when one side starts to unwind
– Fake breakouts that quickly reverse after taking out stops
– Short‑lived trends driven more by liquidity grabs than by fundamentals
For traders using leverage, this combination can be hazardous. A move of only a few percent can be enough to clear out both late bulls and late bears in quick succession.
Current Price Context: ETH Stuck In The Middle
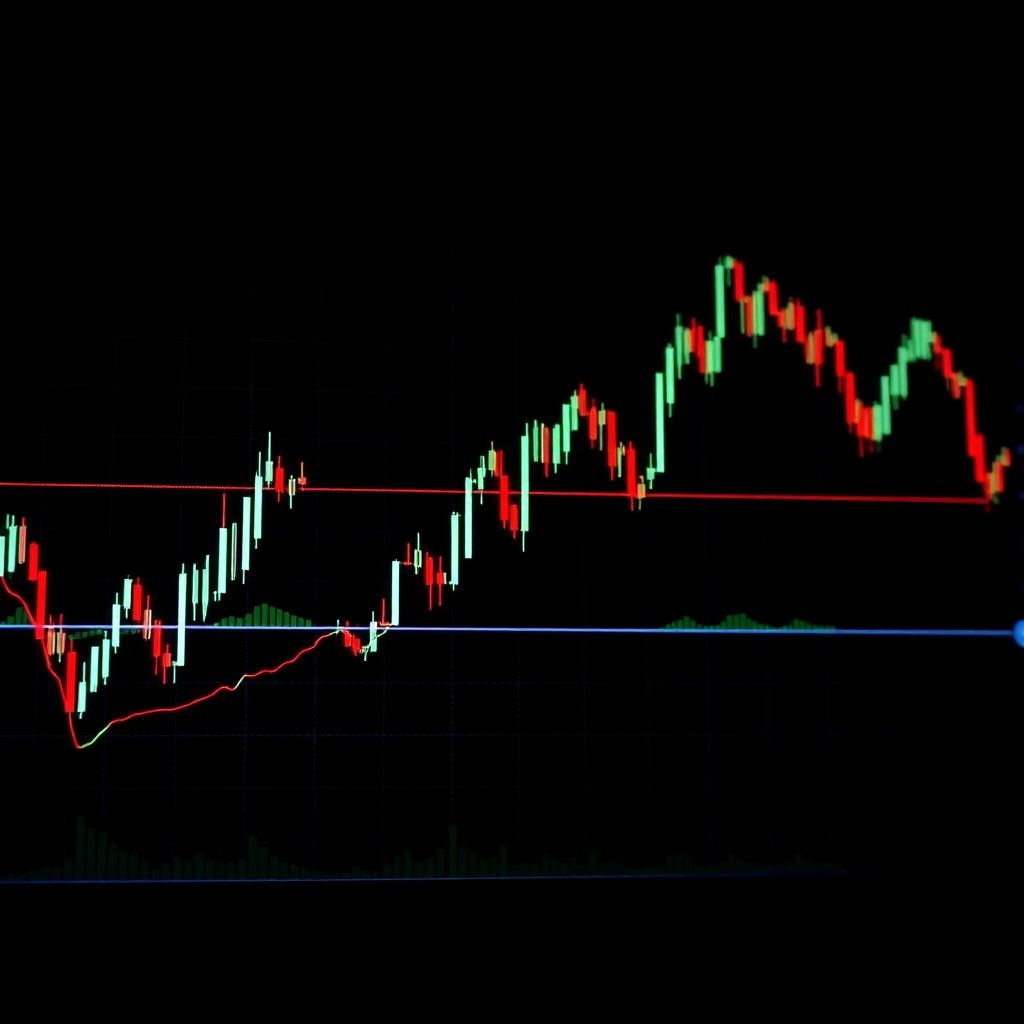
At the time of writing, Ethereum is trading near $1,765, with an intraday low close to $1,704 and a high around $1,768. That positions ETH toward the upper half of the daily range, but still below the $1,900 liquidity pocket highlighted by Pillows.
This placement is crucial: ETH is near the midpoint between the $1,900 resistance‑liquidity area and the $1,600 support‑liquidity area. The closer price drifts toward one of these zones, the greater the likelihood of a rapid move as liquidations start to cascade.
Bullish Scenario: Pull Toward $1,900
The constructive case for Ethereum is relatively straightforward. If buyers can maintain the current recovery and push price higher, the $1,900 region becomes the next logical target.
A climb toward that zone would:
– Put significant pressure on short positions clustered above current price
– Potentially spark a short squeeze if cascading liquidations begin
– Challenge bearish technical setups that anticipate a rollover from supply zones
Many chart watchers are monitoring resistance levels just below $1,900, where previous rallies have stalled. If ETH can break convincingly above those levels on strong volume, it would signal that bulls are regaining control, at least in the short term.
Bearish Scenario: Slide Back Toward $1,600
On the flip side, if the current bounce stalls and sellers step back in, the downside liquidity zone near $1,600 comes into play. That area aligns with several short‑biased technical maps, which identify deeper demand between roughly $1,562 and $1,500.
A move down into that pocket would:
– Trigger liquidations for over‑leveraged longs who entered late into the recovery
– Fit the narrative of a broader corrective structure still in progress
– Reinforce the idea that major buyers are waiting lower, not at current prices
For bears, the ideal outcome would be a decisive break below the $1,600 level, turning it from support into resistance and opening the door to a more extended decline.
Liquidity Clusters Are Not Price Predictions
A critical nuance often missed by less experienced traders is that liquidation maps are not forecasts. They do not say where price must go – only where forced buying (short covering) or forced selling (long liquidations) is likely to appear if price reaches those zones.
In practice, liquidity data should be treated as one piece of a broader puzzle that also includes:
– Raw price action (structure, trend, and key levels)
– Volume behavior (whether moves are supported by participation)
– Macro and sentiment drivers (news, regulatory shifts, risk‑on/risk‑off moves)
Without confirmation from these elements, trading solely based on liquidation clusters is effectively betting on where the next liquidity hunt might occur, which can be highly unpredictable.
What ETH Traders Need As Confirmation
For traders trying to navigate this delicate environment, confirmation is more important than prediction. Rather than guessing which level – $1,900 or $1,600 – will be tagged first, many professionals wait for the market to show its hand.
Some common confirmation tools include:
– Break and retest of key zones: A clean move above or below an important level, followed by a successful retest, often signals a genuine shift in control.
– Volume expansion: Strong volume accompanying a breakout from the current range suggests real commitment from larger players.
– Momentum indicators: Tools like RSI or MACD aligning with the direction of the breakout can help filter out false moves.
– Order flow clues: Signs that aggressive buyers or sellers are stepping in at a level, rather than just passive liquidity being filled.
Until such confirmation appears, the rational stance for many traders is defensive: smaller position sizes, tighter risk management, and a willingness to stay patient.
Range‑Bound Market: Why Both Sides Stay Alert
Right now, Ethereum is effectively locked in a range where both bulls and bears can construct plausible narratives.
– Bulls point to the possibility of a continued recovery, potential institutional accumulation, and the upside pull of the $1,900 liquidity cluster.
– Bears highlight the failure to reclaim higher time‑frame resistance, lingering macro uncertainty, and attractive demand sitting closer to $1,500-$1,600.
Because both stories remain viable, the market is particularly vulnerable to sharp mean‑reversion moves. One side overextends, the other side pounces, and liquidity clusters act as accelerants once price enters their orbit.
Trading Implications: Strategy In A Liquidity Minefield
For active ETH traders, the current setup argues for discipline over aggression. Key tactical considerations include:
– Avoid chasing the first move into a liquidity zone. Initial taps of $1,900 or $1,600 often trigger erratic price behavior as stops are cleared. Waiting for how price behaves *after* that first reaction can be more informative.
– Use clear invalidation levels. In a tightly balanced market, trades should have obvious points where the idea is wrong. That keeps losses manageable when the inevitable fake‑outs occur.
– Reduce leverage. With potential for violent swings both ways, heavy leverage can turn even small misjudgments into large losses.
– Focus on higher time frames. Short‑term noise around liquidity clusters can be brutal. Daily and weekly structures often tell a cleaner story about the prevailing trend.
Patience is an edge in this kind of environment. Many of the best entries appear *after* a liquidity sweep, when the market has cleared out weak hands and established a new direction.
Spot vs. Derivatives: Who Feels It Most?
Liquidity clusters and liquidation maps primarily affect traders in the derivatives markets, where leveraged positions are common. However, the consequences spill over into spot markets as well.
– When a cascade of short liquidations sends price higher, spot traders may see what looks like sudden, “unexplained” strength.
– When long liquidations slam price lower, spot buyers may be offered temporary discounts that vanish as soon as the selling pressure eases.
Long‑term holders often use these events to gradually add to positions rather than trying to time every swing. For them, liquidation cascades are less a threat and more an opportunity, as long as their thesis on Ethereum’s broader trajectory remains intact.
Macro And Narrative: What Could Tip The Balance?
Because the liquidity map is balanced, an external catalyst may be what ultimately decides whether $1,900 or $1,600 is tested first. Potential drivers include:
– Shifts in global risk sentiment that move capital into or out of crypto
– Regulatory announcements that impact Ethereum specifically or crypto broadly
– Developments in Ethereum’s scaling roadmap, staking ecosystem, or major upgrades
– Large flows from institutional players entering or exiting positions
In a market this finely poised, even modest news can trigger a disproportionate reaction as traders rush to one side of the boat, setting off the very liquidation chains that the current liquidity clusters are hinting at.
Big Picture: A Market Waiting For A Decision
For now, the Ethereum market sits in stalemate. A sustained push toward $1,900 would improve the odds that the recovery is more than a dead‑cat bounce and signal that buyers are willing to chase higher prices. A slide back toward $1,600 would reinforce the view that sellers still dominate the broader structure and that more attractive entry points may lie below.
Until one of those zones is convincingly tested and either absorbed or rejected, Ethereum remains range‑bound, with both bulls and bears justified in staying alert and nimble. The liquidity clusters provide a map of where the next wave of forced orders might appear – but it will be price action, volume, and reaction at those levels that ultimately reveal who is really in control.