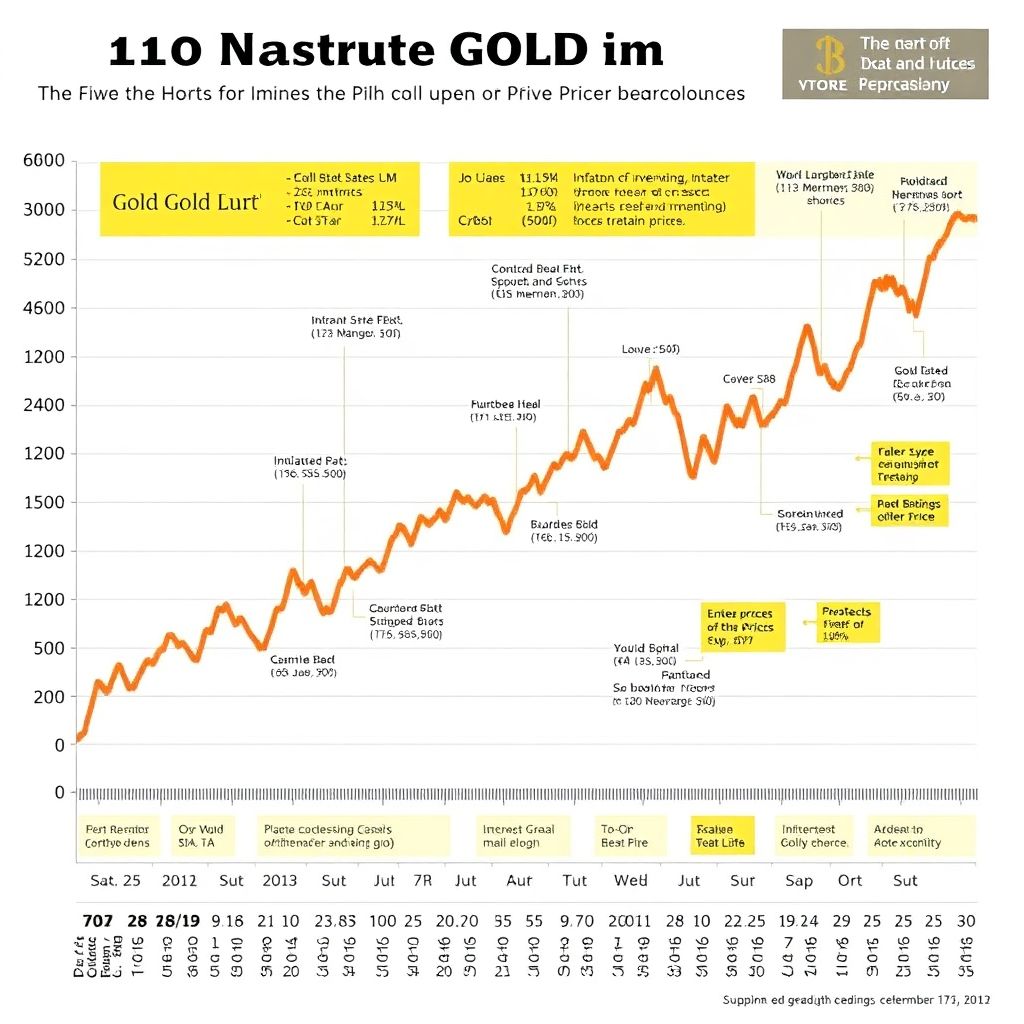
50 years of gold price history: what the charts really show
Gold’s modern price story is surprisingly short. For most of the 20th century, the metal did not trade freely at all: under the Bretton Woods system it was fixed at 35 dollars per ounce. Only after August 1971, when the US suspended dollar convertibility into gold, did the metal enter a true free‑market era.
From that moment on, gold prices began to respond directly to inflation, interest rates, currency moves, central bank policy and geopolitical shocks. The last half‑century of data is effectively one long stress test of gold’s role in the financial system – with some patterns repeating over and over again.
—
The 1970s: the first decade of a free gold price
When gold was finally freed from its official peg, there was no immediate explosion in price. The early 1970s were relatively calm, and the market was still adjusting to the idea that gold could move like any other asset.
That changed dramatically after the 1973 Arab oil embargo. Oil prices surged, inflation in developed economies accelerated, and confidence in paper currencies eroded. Against this backdrop, gold started a defining move: by the end of 1974, it traded near 195 dollars per ounce, almost five times its level only three years earlier.
In 1975, the United States once again allowed private citizens to own gold, triggering a wave of profit‑taking and a temporary pause in the uptrend. Prices consolidated, but the underlying forces remained in place: a weak US dollar, entrenched inflation, and tense geopolitics.
These structural factors culminated in one of gold’s most famous peaks. In January 1980, amid the Iranian Revolution, the Soviet invasion of Afghanistan and a series of inflation shocks during the Carter administration, gold briefly touched about 850 dollars an ounce. Adjusted for inflation, that spike would remain unmatched for more than three decades, a detail often missed when the 2000s bull market is discussed purely in nominal terms.
—
The 1980s and 1990s: two decades of pressure and persistent decline
The period after the 1980 peak is crucial for understanding how gold behaves when conditions turn against it. Instead of a sharp, one‑off collapse, the market endured roughly 20 years of grinding weakness.
Under Federal Reserve Chair Paul Volcker, monetary policy shifted aggressively. Interest rates were pushed higher to crush what was seen as “embedded” inflation. Real rates – interest rates after subtracting inflation – turned solidly positive. The dollar strengthened and global capital flowed into US financial assets that now offered attractive yields.
In such an environment, a non‑yielding asset like gold became relatively less appealing. From its 1980 peak, the price slid and then oscillated mostly between 300 and 500 dollars an ounce for much of the decade. There was no single cause; a combination of contained inflation, high real rates, robust confidence in fiat currencies, and booming equity markets all pulled capital away from the metal.
The 1990s added another major headwind: institutional selling by central banks, particularly in Europe. Several governments concluded that gold held in official reserves generated no income and decided to reduce their holdings. One of the most cited moves was the United Kingdom’s sale of 415 tonnes of gold via a series of auctions between 1999 and 2002. Announced ahead of time and conducted near multi‑decade lows in price, these sales have since become a case study in reserve management and market timing.
Taken together, Europe’s large‑scale disposals reinforced downward pressure just as investor sentiment toward gold was already deeply negative. The message from both markets and official institutions appeared clear: gold was yesterday’s asset.
—
The 1999 bottom and the Washington Agreement
By 1999, the cumulative effect of high real interest rates, a strong dollar, subdued inflation and coordinated central bank selling pushed gold to around 252 dollars an ounce. Valuations that now look extraordinary were widely seen as reasonable at the time.
That same year, a turning point emerged in the form of the Washington Agreement on gold. European central banks agreed to limit the volume of gold they would sell each year. This framework reduced the overhang of potential official sales, bringing more visibility and predictability to the market.
While not an immediate catalyst for a new bull market, the agreement helped stabilize prices near cyclical lows. Importantly, sentiment toward gold had become almost uniformly pessimistic. In hindsight, that broad negativity functioned as a classic contrarian signal: many of the factors suppressing the price were near exhaustion just as investors had largely given up on the asset.
—
The pattern that defined the late 20th century
Across the 1980s and 1990s, a clear pattern emerged that can be seen on longer‑term charts. Gold tended to underperform when several conditions appeared together:
– Real interest rates were meaningfully positive.
– The US dollar was strong against major currencies.
– Inflation was moderate or falling rather than accelerating.
– Confidence in central bank policy and fiat currencies was high.
– Risk assets such as equities and bonds were delivering strong returns.
This combination is not a rigid rule, but it appeared with remarkable consistency over those two decades. It also explains why the low prices of the late 1990s, which now stand out on charts, felt aligned with the macro context at the time. When cash and bonds pay a healthy real yield and financial markets are booming, the incentive to hold a non‑yielding store of value diminishes sharply.
—
Early 2000s: a new bull market quietly begins
Gold’s recovery from its 1999-2001 base was initially modest. Prices edged up from about 270 dollars per ounce in the early 2000s rather than surging overnight. Yet, beneath the surface, several supports were forming.
The dot‑com bubble burst raised doubts about the near‑limitless potential of equities, especially in the US technology sector. The attacks of September 11 heightened geopolitical risk premiums worldwide, reminding investors of the value of perceived safe havens. Meanwhile, the US fiscal position began to deteriorate, with rising deficits contributing to concerns about the long‑term outlook for the dollar.
As the decade progressed, emerging markets – especially in Asia – grew rapidly and accumulated more wealth. Households and central banks in these regions increased their demand for gold, both as jewelry and as a strategic reserve asset. This new buying power contributed to a more sustained uptrend than previous short‑lived spikes.
By the mid‑2000s, gold was firmly in a rising channel. The metal’s performance began to attract a broader investor base, including funds and institutions that had largely ignored it in the previous two decades.
—
The 2000s crisis: surprising moves in both directions
The global financial crisis of 2007-2009 further transformed gold’s role. Initially, during the most acute phase of the panic, gold did not surge as some might have expected. In fact, like many assets, it experienced short periods of selling as investors rushed to raise cash and meet margin calls.
Once the immediate liquidity scramble subsided, however, gold responded in a way that became emblematic of the period. Central banks slashed interest rates to near zero and embarked on large‑scale asset purchase programs. Concerns grew about currency debasement, long‑term inflation and the stability of the financial system itself.
In that climate, gold reached a new nominal high, above 1,000 dollars per ounce, and then pushed significantly higher into the early 2010s. Exchange‑traded products holding physical gold made access easier for a wider range of investors, amplifying demand. For many, the metal became a hedge against both financial system risk and unconventional monetary policies.
—
The 2010s: sharp correction, then a slow rebuild
After peaking in the early part of the decade (around 2011-2012), gold’s price entered another corrective phase. As the worst of the financial crisis faded, attention shifted from systemic risk to economic recovery.
Expectations of gradual interest rate hikes in the United States, a stronger dollar and less extreme monetary policy weighed on the metal. From its high above 1,900 dollars an ounce, gold slipped in stages, at one point losing several hundred dollars from its peak.
Yet unlike the long malaise of the 1980s and 1990s, the 2010s did not produce a full two‑decade bear market. Many of the same supports that had emerged in the 2000s remained in place: sustained demand from emerging markets, a broader institutional investor base, and ongoing geopolitical tensions.
By the latter half of the decade, gold had begun to recover again. While the move was not as dramatic as the early‑2000s rally, prices gradually climbed as investors reassessed global debt levels, political risks and the limits of ultra‑low interest rates.
—
The 2020s: record highs and more complex drivers
The new decade brought another extraordinary stress test. The global pandemic triggered deep economic disruption and unprecedented policy responses. Central banks and governments deployed large fiscal and monetary support measures at a speed and scale rarely seen before.
Gold surged to new nominal records as investors sought diversification amid uncertainty. However, the subsequent spike in inflation from 2021 onward produced a more nuanced picture. Historically, rapid inflation has often been associated with strong gold performance. This time, while the metal did rise, its response was more restrained than some expected.
Several factors help explain this muted reaction. Financial markets anticipated aggressive rate hikes to combat inflation, which pushed real yields higher from extremely low levels. The US dollar strengthened significantly as investors sought relative safety and higher interest rates. Both developments tend to cap enthusiasm for gold.
Even so, over longer horizons, the price has continued to trend upward from its pre‑pandemic levels, and discussions have increasingly focused on the possibility of ranges such as 2,500 to 3,000 dollars per ounce. In this environment, gold is influenced not only by classic inflation worries, but also by concerns about debt sustainability, shifting global power balances, and evolving central bank reserve strategies.
—
Why gold’s reaction to the recent inflation surge was limited
The comparison between the 1970s and the early 2020s is instructive. In both periods, inflation rose sharply. Yet the price behaviour of gold differed. In the 1970s, inflation remained high for years before central banks firmly established credibility. Real rates stayed negative for extended periods, giving gold a powerful tailwind.
In the 2020s, by contrast, monetary authorities signalled early and repeatedly that they were willing to raise rates aggressively. Markets quickly priced in higher policy rates and future disinflation. As real yields climbed from deeply negative to positive territory, the theoretical “carry cost” of holding gold increased, limiting the upside.
Additionally, the breadth of investment options today – from inflation‑linked bonds to a wide array of alternative assets – gives investors more ways to express views on inflation and risk. Gold remains a prominent hedge, but it no longer operates in isolation.
—
From 2,500 to 3,000 dollars: what shapes the current range debates
Discussions about gold trading between 2,500 and 3,000 dollars an ounce highlight how differently investors now think about the metal compared with the 1980s and 1990s. Instead of being viewed as a relic, gold is increasingly framed as one component within a broader multi‑asset strategy.
Several forces shape these range expectations:
– High global debt levels and concerns about long‑term fiscal sustainability.
– Periodic strains in the banking and shadow‑banking systems.
– Shifts in global trade and currency usage, including talk of diversification away from a single dominant reserve currency.
– Ongoing geopolitical tensions that intermittently raise risk premiums.
At the same time, gold faces headwinds whenever central banks maintain or promise relatively high real interest rates and when risk assets deliver strong performance. The resulting tug‑of‑war often produces trading ranges rather than one‑directional trends, at least over shorter time frames.
—
What the full 50‑year chart actually reveals
Looking back over half a century, a few themes stand out clearly from the gold price chart:
1. Gold is highly sensitive to real interest rates and the dollar.
Periods of strongly positive real yields and a robust US currency have consistently coincided with weak or sideways gold markets. Conversely, negative or very low real yields and a soft dollar have often supported strong advances.
2. Inflation matters, but expectations and policy matter just as much.
Inflation alone does not guarantee a gold rally. The key is whether investors believe inflation will persist and whether they trust central banks to contain it without destabilizing growth or currencies.
3. Central banks themselves have been both headwind and tailwind.
The large, pre‑announced sales of the 1990s depressed prices, while limits on sales and later shifts toward net gold purchases by some central banks contributed to more supportive conditions.
4. Geopolitical crises tend to create spikes, but structural trends are usually macro‑driven.
Events such as revolutions, wars or terrorist attacks can trigger sharp short‑term moves, yet the long arcs on the chart align more closely with interest rate cycles, currency trends and longer‑term economic confidence.
5. Sentiment extremes often mark turning points.
The deeply negative view of gold at the end of the 1990s set the stage for a substantial multi‑year bull market. Similarly, periods of euphoria have sometimes preceded lengthy corrections.
—
How investors now interpret this history
The 50‑year record has reshaped how many market participants think about gold. Rather than seeing it purely as an inflation hedge, they increasingly consider it:
– A potential diversifier that may behave differently from stocks and bonds in certain crises.
– A store of value that is less directly tied to any single government or currency.
– An asset whose long‑term performance depends on cycles in real rates, the dollar, and confidence in monetary and fiscal policy.
The history also underlines that gold can remain out of favour for long stretches when conditions are hostile, just as it can outperform strongly when macro trends align in its favour. Time horizon and risk tolerance are therefore central when interpreting past price swings.
—
The role of emerging markets and new forms of demand
Another lesson from the past two decades is the changing geography and structure of gold demand. Emerging economies with growing middle classes have become major consumers of jewelry and investment bars. Central banks in some of these countries have added to their reserves, in part as a diversification measure.
On the investment side, the development of physically backed exchange‑traded products has opened the market to participants who previously did not have easy access to bullion. These vehicles can magnify flows both into and out of gold, accelerating trends that the underlying macro environment has already set in motion.
This evolution means that gold is no longer driven solely by Western monetary policy; demand from Asia, the Middle East and other regions now plays a significant role in shaping price dynamics.
—
Reading the chart: from past cycles to future scenarios
The past 50 years do not offer a simple formula for future prices, but they do outline a framework. Historically, combinations of the following have been supportive for gold over multi‑year periods:
– Low or negative real interest rates.
– Persistent doubts about inflation control or debt sustainability.
– Weakening confidence in major currencies.
– Heightened or recurring geopolitical tensions.
Conversely, stretches marked by strong growth, rising real yields, a powerful dollar and high conviction in central bank credibility have often coincided with weaker gold performance.
Understanding which of these environments is closest to the present conditions can help interpret where current prices sit within the broader historical context.
—
Educational note
Gold’s modern market history is a case study in how one asset can respond to shifting macroeconomic and political forces. Its price over the last five decades has been shaped by inflation cycles, interest rate regimes, central bank actions, currency trends and major global events.
This overview is intended for educational purposes only and does not constitute investment advice.