Is CRV on the verge of losing its crucial $0.20 support?
CRV, the governance token of Curve DAO, is trading around $0.2118 as of April 6, having shed 8.10% in the last 24 hours. Price action remains locked inside a long-running descending channel that has guided the trend since late 2025, with the token now leaning heavily on the channel’s lower boundary. That support zone converges around the psychologically important $0.20 mark, setting up a make-or-break moment for bulls and bears alike.
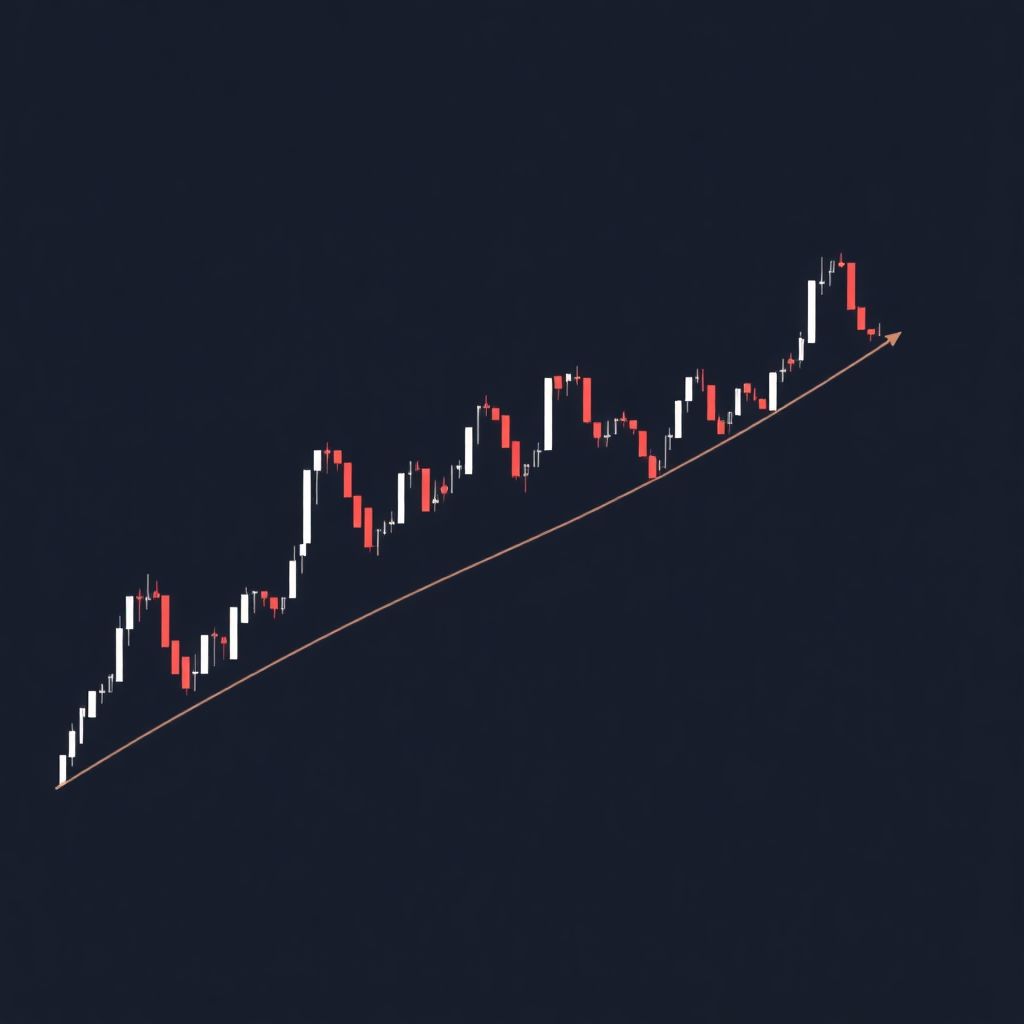
Descending channel compresses price toward a binary outcome
On the daily timeframe, CRV has been moving within a clearly defined downward channel for months. The upper boundary of this structure currently aligns with the daily Supertrend indicator near $0.2495, acting as dynamic resistance and reinforcing the broader bearish bias.
On the downside, the lower channel edge is sliding toward $0.20, leaving price trapped in a tightening range. Such compression often precedes a stronger directional move, as volatility is effectively “stored” while traders wait for a breakout or breakdown.
If the lower boundary holds, CRV could stage a relief rebound within the channel, aiming first at mid-range levels and then potentially challenging $0.2495. A decisive breakdown, however, would push the token into price territory that has not been revisited since 2024 and could open the door to a deeper bear leg.
MACD hints at early stabilisation, but conviction is weak
Technically, the daily MACD indicator is sending a cautious, early sign of possible stabilisation. The MACD line has nudged up to 0.0005 and crossed just above the signal line at -0.0078. In isolation, such a crossover would typically be read as the first step towards a trend pause or reversal.
However, this signal is not currently backed by a surge in trading volume. Without a convincing increase in buy-side activity, the MACD crossover looks more like a tentative pause in downside momentum than a clear bullish shift. For traders, that means confirmation is still lacking: the chart shows the potential for a floor, but not yet a compelling reason to believe that floor will hold.
4-hour wedge pattern: bullish structure, neutral momentum
Zooming in to the 4-hour chart, CRV has carved out a descending wedge pattern. This structure is formed by two converging downward-sloping trendlines, with the lower bound currently around the Supertrend support at $0.2071 and the upper bound near $0.2224.
From a technical analysis standpoint, descending wedges are traditionally viewed as bullish reversal formations. They indicate that while sellers remain in control of direction, their strength is gradually waning as each new low is less aggressive than the last.
Yet, the 4-hour MACD at 0.0004 is essentially flat, offering little in the way of directional insight. Momentum, for now, is subdued. That leaves the wedge pattern as a potential but unconfirmed bullish cue: the structure suggests upside risk is building, but the market has not yet validated that scenario with momentum or volume.
Key levels to watch: $0.2071, $0.20, $0.2224, $0.2495, and $0.18
Several price zones have emerged as critical reference points for traders:
– Immediate 4H support: $0.2071
This level, aligned with the 4-hour Supertrend, is the first line of defence. A sustained 4-hour close below $0.2071 would weaken the wedge’s bullish interpretation and raise the odds of a direct test of $0.20.
– Major psychological and structural support: $0.20
The $0.20 mark is both a psychological barrier and the projected lower edge of the daily descending channel. A daily close beneath this threshold would signal a notable breakdown in structure, increasing the likelihood of further downside.
– Deeper downside reference: $0.18
Should $0.20 fail, the next meaningful support level sits near $0.18, which corresponds to CRV’s August 2024 low. This area represents the extended bear-case target and a zone where traders would reassess the longer-term thesis on Curve DAO’s token.
– Initial resistance on lower timeframe: $0.2224
The upper boundary of the 4H descending wedge, at $0.2224, is the first upside hurdle. A break and close above this level on the 4-hour chart would be an early sign that sellers are losing control and that the wedge is starting to resolve higher.
– Primary daily resistance: $0.2495
The daily Supertrend and upper channel boundary around $0.2495 is the key ceiling that needs to be reclaimed to challenge the broader bearish structure. Only a confirmed daily close above this level would meaningfully threaten the integrity of the descending channel and offer a credible argument for a medium-term trend shift.
Exploit overhang: sentiment still bruised after March 2 incident
Beyond pure technicals, sentiment around CRV has been hampered by a security incident earlier this year. On March 2, a flash loan exploit targeted the sDOLA-crvUSD pool on Curve’s LlamaLend platform. The attack stemmed from a misconfigured oracle, which temporarily distorted pricing within that specific pool.
Curve Finance clarified that the protocol’s core contracts were not compromised and remained fully functional. Even so, markets often price risk asymmetrically after such episodes. Investors tend to demand a higher risk premium, particularly for governance tokens linked to affected ecosystems, and that additional perceived risk has weighed on CRV’s recovery prospects.
This lingering distrust does not necessarily reflect the protocol’s long-term viability, but it does help explain why bounce attempts have been faded quickly and why the market remains cautious even when technical patterns appear constructive.
Derivatives market signals: cautious optimism, not capitulation
Data from the derivatives market helps fill in the picture of trader sentiment. As of late March, CRV futures open interest had slipped by 11.47% to roughly $74.45 million. Declining open interest alongside price weakness typically indicates that some leveraged participants are exiting rather than doubling down, reflecting risk reduction rather than aggressive shorting.
At the same time, the OI-weighted funding rate stands mildly positive at about 0.0067%. This implies that, on balance, longs are paying shorts, meaning there is still a slight lean toward net-long positioning despite the downtrend. Instead of a market dominated by bears, this looks more like one where participants are cautiously positioning for eventual upside but are not yet willing to commit heavily.
A market analyst recently characterised this phase as “accumulation, not decline,” suggesting that some participants see current levels as an opportunity to gradually build positions. However, the same analysis emphasised that a true bullish reversal would only be confirmed if CRV can push back toward the $0.30-$0.32 band. From today’s prices near $0.21, that remains a significant distance, and the current technical structure has not yet validated such a scenario.
What would a bearish break below $0.20 mean?
If CRV closes a daily candle below $0.20, the move would mark a clear technical breakdown. Several implications follow:
– Sentiment shock: Losing a round-number support often triggers additional selling as traders who were “waiting for confirmation” exit positions.
– Increased downside volatility: Stop-loss orders clustered below $0.20 could cascade, accelerating a push toward $0.18 or even intraday spikes below that before stabilisation.
– Repricing of risk: A failure to hold this level may cause the market to reassess Curve DAO’s near-term prospects, particularly in the context of recent exploits and the broader DeFi risk environment.
– Long-term opportunity zone: Historically, such extreme capitulation areas can later prove to be attractive accumulation levels for long-term participants, but timing entries becomes critical and risky.
For short-term traders, a confirmed break below $0.20 would likely shift focus towards short setups or hedges until a new base is clearly formed. For longer-term holders, the zone between $0.20 and $0.18 may be treated as a high-risk, high-uncertainty scenario where conviction and time horizon matter more than intraday swings.
What would a bullish defence of $0.20 look like?
On the other hand, if $0.2071 holds on the 4-hour chart and $0.20 remains intact on a daily closing basis, the setup could flip from defensive to opportunistic:
– A bounce from the $0.2071-$0.20 region, accompanied by increasing volume, would strengthen the argument that sellers are exhausting.
– A breakout above $0.2224 on the 4H wedge would suggest that the market is starting to respect the bullish reversal potential of the pattern.
– Follow-through toward $0.2495 would then become the key test. Reclaiming that level on a daily close would be the first convincing evidence that the descending channel is losing its grip on price action.
In that scenario, short-term traders might look for long entries on pullbacks above broken resistance levels (turned support), while more conservative participants would likely wait for a confirmed daily close above $0.2495 before entertaining a broader trend reversal thesis.
How this setup fits into the broader DeFi landscape
CRV’s price dynamics cannot be fully separated from the larger DeFi environment. As one of the sector’s foundational decentralised exchange protocols, Curve’s token is often treated as a proxy for sentiment around stablecoin liquidity, on-chain yields, and DeFi infrastructure risk.
Periods of regulatory uncertainty, macro-driven risk-off moves, or high-profile hacks across DeFi can all contribute to compressed valuations for governance tokens, even if protocol fundamentals remain sound. Conversely, renewed appetite for on-chain yield strategies, stablecoin trading, or institutional engagement with DeFi could improve the backdrop for assets like CRV, making technical supports such as $0.20 more likely to hold.
In other words, while CRV’s immediate fate is being decided on the chart, the strength or weakness of the wider crypto and DeFi cycle will heavily influence whether a bounce gains traction or a breakdown accelerates.
Risk management considerations for traders
Given the current setup, both bullish and bearish traders face an environment where levels are clearly defined, but outcomes are still binary:
– For short-term speculators:
– Aggressive bears may look for breakdown entries on a clean 4H close below $0.2071, targeting $0.20 and then $0.18, while keeping stops tight above reclaimed resistance.
– Aggressive bulls might anticipate a bounce from the $0.2071-$0.20 area, but the lack of confirmed momentum means position sizing and stop placement are crucial.
– For swing traders:
Many will likely prefer to wait for a decisive move: either a daily close below $0.20 to lean into downside continuation, or a daily close above $0.2495 to begin building a case for trend reversal.
– For long-term participants:
The current zone may be viewed as a potential accumulation area under the assumption that Curve DAO’s role in DeFi will remain structurally important. However, this approach accepts significant drawdown risk and requires a multi-year horizon.
Outlook: high-stakes compression around $0.20
CRV’s price structure is approaching a critical inflection point. The confluence of a long-standing descending channel, a narrowing 4H wedge, and the looming $0.20 psychological barrier gives the current range unusually high significance.
If $0.2071 breaks on the 4H chart, a direct test of $0.20 becomes increasingly likely. How the market reacts there will set the tone for the next phase: either a breakdown towards $0.18 and a more entrenched bearish regime, or a defended floor that allows the token to challenge $0.2224 and eventually the key $0.2495 resistance.
Until one of those lines is convincingly crossed, CRV remains in a fragile balance-caught between cautious accumulation and persistent selling pressure, in a DeFi market still wrestling with both technical risk and shifting macro conditions.