Bitcoin price is showing increasing signs of vulnerability as trading compresses beneath a key resistance zone and a potential bear flag pattern takes shape. After losing its former range high and failing to reclaim it, the market has shifted from neutral to clearly defensive, with downside risk now dominating the outlook and the $80,000 area emerging as the next major level to watch.
Shift in structure: from breakout attempt to bearish follow‑through
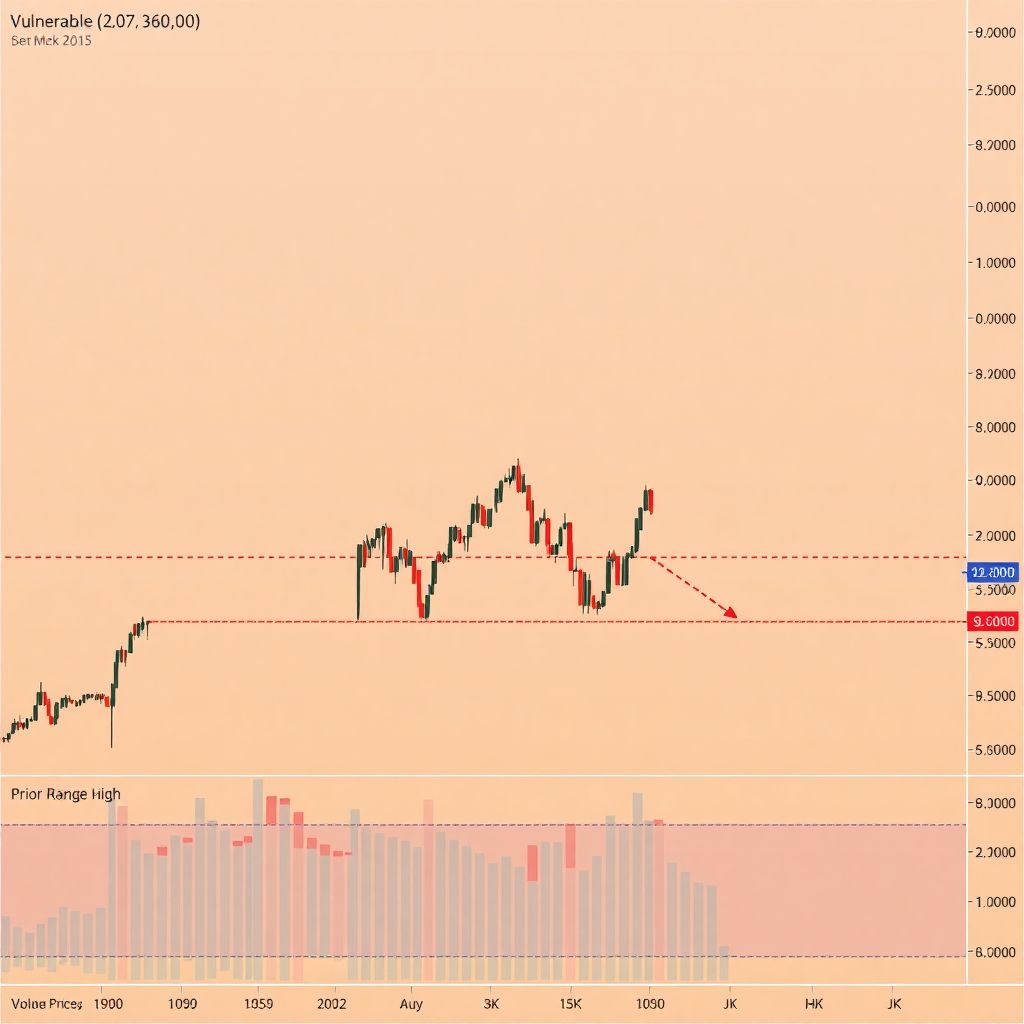
The crucial development in recent price action was the breakdown from the previous range high, which had acted as a pivotal support area. Price briefly traded above this threshold, but the move proved unsustainable. Once buyers failed to establish acceptance above that level, sellers quickly stepped in, triggering a sharp downward expansion.
This failure transformed what initially looked like a potential continuation of the uptrend into a rejection and reversal. The market structure flipped: instead of consolidating above support, Bitcoin slipped back into the range, and the former support now behaves as resistance. Each attempt to push higher is being met with selling pressure rather than follow‑through buying.
This kind of role reversal—where a broken support turns into resistance—is a classic sign that control has passed from buyers to sellers. As long as price holds below that reclaimed resistance zone, rallies are more likely to be viewed by market participants as opportunities to exit or reduce exposure, not as a foundation for a new leg up.
Consolidation with a bearish tilt
After the initial downside impulse, Bitcoin has entered a period of consolidation around the midpoint of the broader trading range. On the surface, this sideways action might look like the market is simply cooling off and seeking equilibrium. However, the internal structure of this pause paints a more negative picture.
Instead of forming a rounded bottom or a broad accumulation base, the price is compressing inside a downward‑sloping channel. Highs are getting lower, and the bounces lack aggressive follow‑through. This specific configuration strongly resembles a bear flag, a pattern that typically appears after a strong sell‑off and often precedes another leg lower.
The longer Bitcoin stays confined within this descending channel without reclaiming the broken resistance above, the more credible the bear flag scenario becomes. In technical terms, time spent under resistance without meaningful upside reclaim usually favors continuation in the direction of the prior impulse—in this case, down.
Why the potential bear flag matters
Bear flags are important because they describe not just price geometry, but underlying behavior. They indicate a market that is pausing, not reversing. After a sharp drop, confident buyers in a healthy trend reversal tend to step in aggressively, pushing price higher with expanding volume and strong candles. That is not what the current structure is showing.
Instead, demand appears subdued. Volume has generally declined during the consolidation, and upward moves have been shallow and short‑lived. Every push higher meets supply, and the market fails to build higher lows with any conviction. This is typical of a digestion phase where participants are still more focused on reducing risk than on accumulating.
Statistically, bear flags resolve downward more often than not. While no pattern guarantees an outcome, the broader context—loss of the range high, decisive bearish impulse, and weak bounce dynamics—adds weight to the probability that the dominant trend resumes to the downside rather than flipping bullish.
$80,000 as a key support and liquidity magnet
The next major area of interest sits around $80,000, which stands out as a significant high‑time‑frame support zone. This level is not just a psychological round number; it also likely hosts substantial resting liquidity in the form of stop losses and passive buy orders.
Markets are naturally attracted to such liquidity clusters. When price has downside momentum and a well‑defined pocket of orders lies below, it often gravitates toward that area as large players seek efficient execution. If the bear flag confirms with a break to the downside, a move into the $80,000 region becomes a logical technical target.
A test of this support could allow the market to reset, flush out late longs, and potentially lay the groundwork for a more durable base. However, if $80,000 fails to hold on a closing basis, it would signal that sellers remain firmly in control and could open the door to a deeper and more prolonged corrective phase.
Market structure: lower highs keep pressure on buyers
From a structural point of view, Bitcoin continues to print lower highs beneath the reclaimed resistance zone. Each rebound stalls below the previous local peak, reinforcing the notion that buyers are losing strength on every attempt.
This pattern of lower highs is a core component of a bearish market structure. It means that the path of least resistance, for now, points downward. Until price can break that sequence—by reclaiming the former range high and sustaining trade above it with convincing volume—any bounce is best interpreted as a counter‑trend move within a larger corrective environment.
For trend‑focused participants, the trigger for a meaningful shift in bias would be a clear, impulsive move above the upper boundary of the flag and the prior resistance band, followed by evidence that those levels are holding as new support. Without that, the assumption remains that sellers will continue to fade rallies.
What the coming price action could look like
As long as Bitcoin trades inside the bear flag and remains capped by former support turned resistance, the most probable scenario is further choppy consolidation with a downside tilt, eventually resolving in a break lower. In that case, a test of the $80,000 area is the primary scenario.
A typical pattern might involve one or more “fake‑out” attempts to the upside within the flag, where price briefly spikes higher only to be sold down quickly. Such moves can trap short‑term buyers and provide additional fuel for the next leg lower as their stops are triggered. Traders should be prepared for these kinds of whipsaws in a consolidation environment.
If the breakdown does occur, the nature of the move into $80,000 will be important. A fast, capitulation‑style drop followed by an immediate strong bounce could suggest that buyers are eager at that level. A slow grind, on the other hand, with weak bounces and persistent selling, would hint at the possibility of deeper downside beyond that first support.
How traders and investors can interpret the setup
For short‑term traders, the presence of a potential bear flag suggests that short‑biased setups may offer better reward‑to‑risk as long as price remains below the flag’s upper boundary and the former range high. However, confirmation is critical: pre‑emptively positioning without a breakdown or clear rejection at resistance carries elevated risk.
More conservative participants may choose to wait for one of two clear signals:
1. Bearish confirmation: A decisive break below the lower boundary of the flag with expanding volume, aiming toward the $80,000 zone as a first target.
2. Bullish invalidation: A strong breakout above the flag and reclaimed resistance, followed by consolidation or retests that hold those levels from above.
Long‑term investors, meanwhile, might view a potential move toward $80,000 as part of a larger cyclical correction rather than a structural failure of the asset. For them, the focus is less on the exact short‑term pattern and more on whether key weekly and monthly supports hold over time. Still, even longer‑horizon participants benefit from understanding when short‑term structures are skewed to the downside, as it can influence the timing of entries and position sizing.
Risk management in a bearish‑leaning environment
Regardless of time frame, the current setup emphasizes the importance of risk management. In an environment where the chart is signaling elevated downside risk:
– Position sizes should be calibrated to account for higher volatility and the possibility of sharp extensions in either direction.
– Stop‑loss levels need to be placed beyond obvious liquidity pockets, as these areas are often targeted during intraday spikes.
– Traders should avoid over‑leveraging into what is still a probabilistic pattern, not a certainty.
Maintaining flexibility is crucial. Markets can invalidate bearish or bullish structures quickly, and clinging to a single scenario even as evidence shifts is often more damaging than missing a move.
What would genuinely flip the narrative?
To meaningfully challenge the bearish outlook, Bitcoin would need to do more than just bounce within the existing range. The market would look for a series of constructive signals:
– A clean breakout above the bear flag’s upper trendline.
– Reclaiming and holding the former range high as support, rather than failing on retests.
– Rising volume and stronger breadth on up‑moves, showing renewed conviction from buyers.
– A shift from lower highs to at least equal, and ideally higher, swing highs on key time frames.
If those conditions start to emerge, the current pattern could be reinterpreted not as a bear flag but as an early phase of re‑accumulation. Until then, however, caution is warranted.
Bottom line: cautious stance while the flag holds
Bitcoin is sitting at a critical juncture. The breakdown from the former range high, the shift of that level into resistance, the formation of a downward‑sloping consolidation, and the proximity of a major support and liquidity zone around $80,000 all combine into a technically cautious picture.
As long as price trades beneath the prior range high and within the suspected bear flag, probabilities lean toward continued weakness and a potential test of $80,000. Only a forceful reclaim of resistance and a clear invalidation of the flag structure would meaningfully reduce the downside risk currently in focus. Until such a shift occurs, the dominant message from the chart remains the same: the burden of proof is on the bulls.