XRP slides to major support as traders eye bullish reversal signal
XRP has retreated to a pivotal price area after a month-long decline, drawing intense focus from technical traders who argue that the current zone could become the launchpad for the next bullish leg—if it holds.
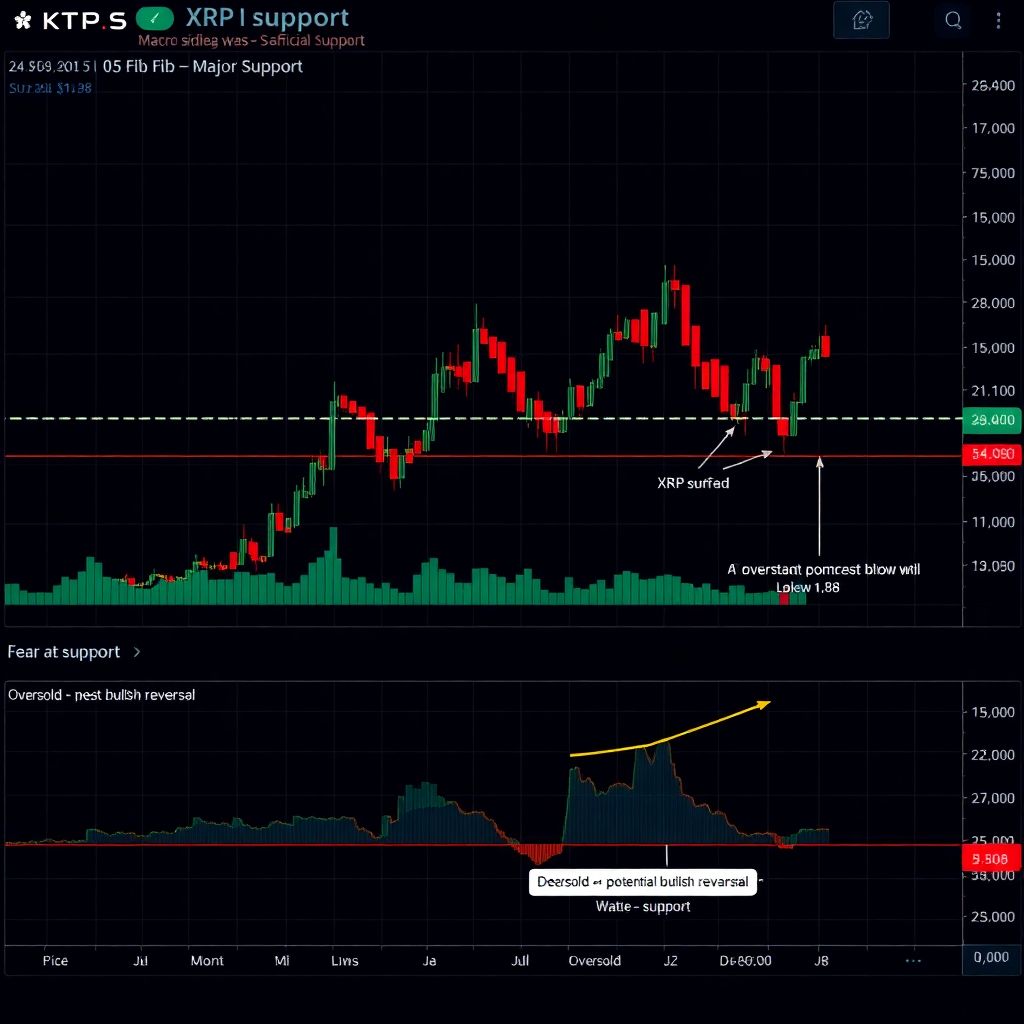
Over the past 30 days, the token has steadily pulled back, registering a new intraday low within the last 24 hours, according to market data aggregators. This correction has now brought XRP directly onto what analysts describe as a “macro” support area, aligning with the 0.5 Fibonacci retracement level on higher‑timeframe charts.
Macro support at the 0.5 Fibonacci retracement
On multi-day and weekly charts, the 0.5 Fibonacci retracement often acts as a decisive battleground between bulls and bears. In XRP’s case, this level sits around the 1.88 dollar mark, which crypto analyst Tara characterizes as a “very strong support level” due to multiple technical factors converging there.
This same area previously acted as a springboard: on November 21, XRP bounced off this support and rallied within the next 48 hours, confirming it as a key pivot in the current market structure. The clustering of several Fibonacci levels in this region further reinforces its importance, suggesting that the market has repeatedly recognized this zone as fair value during the broader trend.
Fear at support: why traders get nervous here
Despite the strength of the level, price behavior around it is often psychologically uncomfortable. As Tara points out, traders typically feel the most fear when price is sitting directly on support rather than moving away from it. That sense of unease is amplified when the market has spent weeks drifting lower, as XRP has over the last month.
Technically, however, repeated retests of support are not automatically bearish. Each test allows the market to absorb remaining sell orders. When sellers are exhausted and no longer able to push price decisively lower, the setup for a strong rebound becomes more likely. The key is not the number of touches, but whether price eventually loses the level with conviction or launches from it.
“It’s going to get bullish!” — the critical reaction zone
Tara stresses that what matters now is XRP’s reaction at this macro 0.5 Fibonacci region, not just the fact that price has arrived there again. If the token holds above this area and avoids printing a clear new low, the analyst expects a constructive shift in momentum. In that case, the structure could transition from corrective to accumulative, creating conditions for a sustainable upside move.
According to the analysis, a successful defense of this support would open the door to mid‑term bullish targets, potentially being reached before the end of the year. The scenario hinges on one condition: buyers must prevent a decisive breakdown below the current range.
Conversely, if XRP closes firmly beneath this support and confirms the move with follow‑through selling, the bullish thesis would be invalidated. That would shift traders’ attention to deeper retracement zones, where the next logical areas of interest lie at lower Fibonacci levels and prior demand zones on the chart.
Momentum indicators flash oversold conditions
Adding weight to the bullish‑reversal argument, momentum readings are signaling exhaustion on the downside. On the 4‑hour chart, the Relative Strength Index (RSI) has slipped into oversold territory, a region historically associated with at least short‑term relief rallies.
Oversold readings do not guarantee an immediate bounce, but they often precede phases where selling pressure eases and volatility compresses. This aligns with the current price action: rather than violently slicing through support, XRP appears to be “compressing” against the level, with the pace of the decline slowing as the token hovers above 1.88 dollars.
Price compression: a prelude to a move
When price consolidates tightly around a key level, it typically sets the stage for an impulsive move in one direction or the other. In XRP’s case, the ongoing compression near macro support suggests that market participants are in a state of indecision, waiting for a trigger.
A strong bullish candle off this zone—accompanied by rising volume and an RSI recovery from oversold territory—could be interpreted as confirmation that demand is reclaiming control. On the other hand, a high‑volume breakdown with closing prices well below support would be a clear signal that bears have overpowered the remaining buyers.
Why the 0.5 Fibonacci level matters to swing traders
Many swing and position traders rely on Fibonacci retracements to identify areas where trends may pause or reverse. The 0.382 and 0.5 levels often act as “healthy correction” zones within a broader uptrend, where larger players look to re‑enter positions at discounted prices.
In XRP’s case, the ongoing pullback into the 0.5 region can still fit the narrative of a normal corrective phase—provided the level holds. A bounce from here would maintain the broader bullish market structure, characterized by higher lows and higher highs on larger timeframes. A failure, however, would suggest that the previous uptrend was weaker than assumed and that the market needs to probe lower for true demand.
Psychological levels and liquidity pools
The 1.88 dollar area is not just a mathematical Fibonacci point; it also acts as a psychological and liquidity zone. Traders who bought during the last bounce from this level are closely watching whether price will defend their entries. Some may place stop‑loss orders slightly below support, creating a “liquidity pool” that can attract aggressive sellers.
If market makers or larger players temporarily push price below support to trigger those stops and then quickly reclaim the level, that behavior can form a “fakeout” or deviation pattern, often followed by sharp reversals upward. Traders will therefore be paying close attention not only to daily closes, but also to how deep and how long any potential dip below 1.88 might last.
Risk management around a critical inflection point
For active traders, this kind of setup is both an opportunity and a risk. Long‑biased participants may see the macro 0.5 support and oversold RSI as favorable conditions for taking positions with relatively tight invalidation levels just below support. Bears, in contrast, may view any weak bounce as a chance to short, anticipating that the level will eventually fail.
In both cases, risk management becomes essential. Because price is poised near a major inflection point, volatility can increase sharply in either direction. Using predefined stop‑loss levels, position sizing that reflects account tolerance, and clear invalidation scenarios is crucial in such environments.
Mid‑term outlook: conditions for a sustainable uptrend
If XRP manages to hold above 1.88 dollars, form a higher low, and reclaim nearby resistance zones, the market could shift toward a more constructive mid‑term trend. Traders will be watching for:
– A series of higher lows on the 4‑hour and daily charts
– RSI exiting oversold territory and stabilizing in a neutral or bullish range
– Growing trading volume on up‑moves rather than on sell‑offs
– Breaks and retests of local resistance levels as new support
These developments would support the view that the current decline was a corrective phase within a larger bullish cycle, rather than the start of a prolonged downtrend.
What to watch next
At the moment of writing, XRP is attempting to stabilize above the macro support zone. The market is essentially in a holding pattern: neither side has delivered the decisive move that confirms the next leg.
Going forward, the critical questions are:
– Does price close multiple sessions above 1.88, confirming the level as defended support?
– Does the RSI recover from oversold while price holds or climbs, signaling a momentum shift?
– Or does a clean breakdown below the current range occur, forcing traders to reassess and target lower retracement regions?
Until one of these scenarios plays out, XRP remains at a crossroads. For now, the chart suggests that the next major move will be defined not by where support is drawn, but by how the market reacts to it—and whether, as some analysts predict, “it’s going to get bullish” from here.