Cardano bulls face growing pressure as ADA loses grip on key trend support, slipping beneath a long-standing ascending channel and forcing traders to reassess the risk of a deeper pullback. What had previously served as a reliable support structure has now flipped into resistance, leaving the token hovering precariously above weaker lower support and vulnerable to further declines.
At the time of writing, spot ADA changes hands in the 0.38–0.39 USD area across major trading venues, reflecting muted intraday volatility and the absence of extreme liquidation spikes or dramatic wicks. Price action has cooled noticeably after an earlier attempt at upward continuation failed, signaling that buyers were unable to maintain control of the trend.
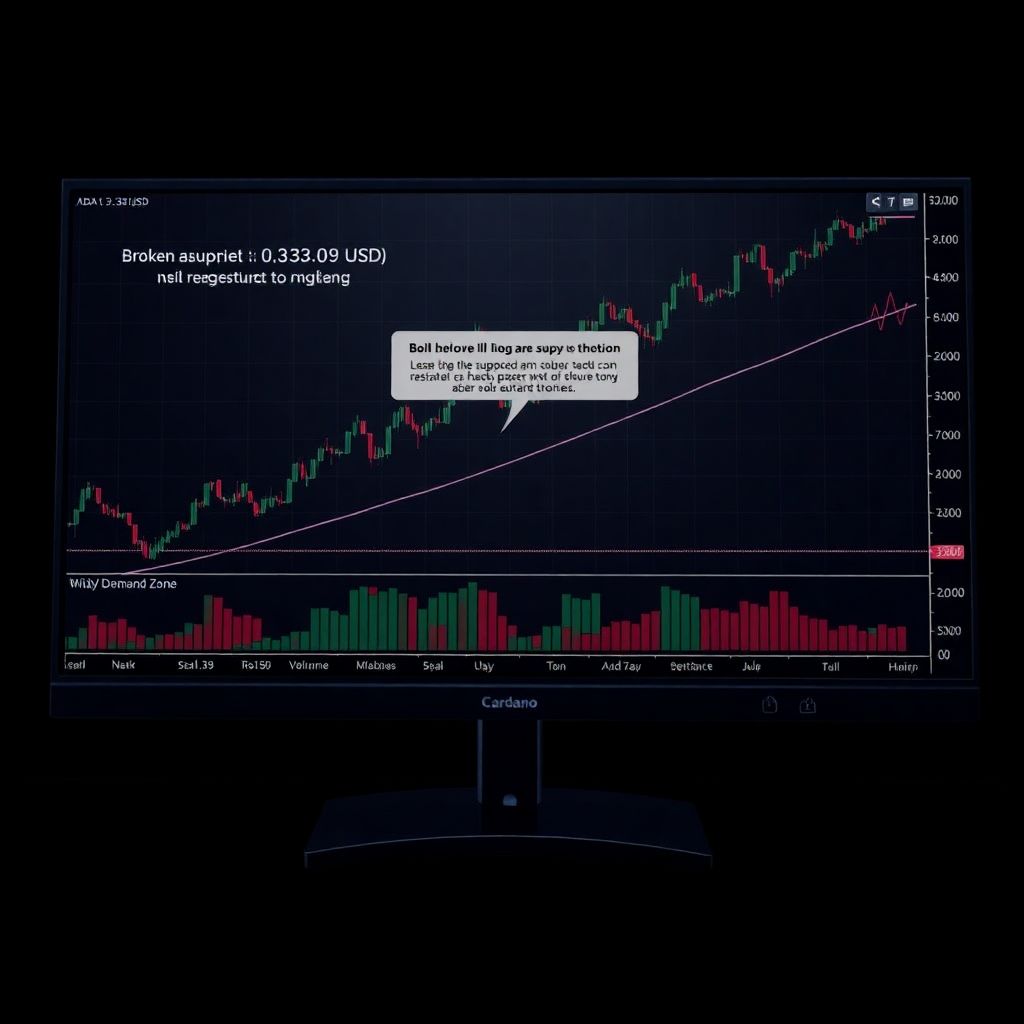
The transition from a constructive uptrend to a more fragile setup is visible on higher‑timeframe charts. For weeks, Cardano traded within an ascending channel characterized by a series of higher highs and higher lows. This structure acted as a visual roadmap for bullish momentum. However, once ADA slipped below the channel’s lower boundary and failed to reclaim it, the market received a clear technical warning: trend support had broken, and the same zone is now acting as resistance.
To negate this breakdown, analysts highlight a specific “must‑reclaim” region just above the former channel floor. Only a sustained move back into or above that band would suggest that the breakdown was a false move rather than the start of a larger corrective phase. Until that happens, every attempt to push higher risks being rejected at the underside of the old channel, reinforcing the bearish tone.
Short‑term charts tell a similar story of deterioration. After marking a local high earlier this month, ADA has been grinding lower, carving out a sequence of lower highs while clinging to a relatively weak support area underneath current prices. Bounce attempts have been shallow and short‑lived, with no aggressive bullish candles to signal a meaningful shift in momentum.
Volume dynamics add weight to the negative narrative. Trading activity expanded as price pulled back, indicating that sellers were active and willing to offload positions rather than simply stepping aside in a thin market. That pattern resembles distribution rather than a calm, low‑liquidity retracement, increasing the risk that the move is part of a broader trend change instead of a routine dip.
From a structural viewpoint, the technical picture now hinges on how ADA behaves around two critical zones: the reclaimed‑or‑rejected former support above, and the deeper, untested support below. A convincing recovery through the overhead resistance band would open the door to stabilization and the eventual resumption of the prior uptrend. Failure to do so, especially if accompanied by another spike in sell volume, keeps the scenario of a more pronounced decline firmly on the table.
If weakness persists, higher‑timeframe charts point toward a lower price area as the next major demand zone. This deeper support region represents the level at which longer‑term participants may look to re‑accumulate if the market becomes oversold. However, waiting for that area comes with its own risks: a sharp move down can trigger fear, forced selling, and a reset of speculative interest, prolonging the recovery.
For now, Cardano appears to be in a transitional phase rather than a clear, established trend. The market is caught between the memory of a bullish channel and the reality of trading below it. In this environment, structure is more informative than sentiment. Traders are watching for confirmation – either a decisive reclaim of the critical resistance band or a firm breakdown through current support – to determine the next directional move.
What this means for traders and investors
For short‑term traders, the loss of the ascending channel shifts the playbook from “buy the dip” to “sell the rip” until proven otherwise. Intraday and swing participants may now treat the underside of the former channel as a supply zone, looking for rejection candles, bearish divergences, or failed breakouts to initiate or add to short positions. Risk management becomes crucial: with volatility subdued for now, stops may need to be tighter, as sharp moves can emerge quickly once a direction is confirmed.
Longer‑term holders face a different decision matrix. The breakdown does not necessarily invalidate Cardano’s broader fundamental narrative, but it does warn that the previous phase of steady appreciation has lost momentum. Investors with a multiyear horizon may use deeper pullbacks into stronger weekly or monthly support zones as strategic accumulation opportunities, yet they must be prepared for extended consolidation and emotional volatility if the market continues to trend down.
Key levels to watch on the chart
Technically oriented market participants are focusing on three main areas:
1. Immediate resistance (former channel support): This is the zone just above current prices where ADA previously found buyers. It now acts as a barrier. Multiple failed attempts to break through it would reinforce the bearish structure.
2. Current fragile support: The level where ADA is presently hovering serves as a short‑term line in the sand. A sustained hold here, especially with decreasing sell volume, could signal that selling pressure is fading. A clean break below, backed by volume, would likely accelerate downside.
3. Deeper higher‑timeframe support: This lower price band, visible on daily and weekly charts, is where more substantial demand might emerge. If ADA falls into this zone, traders will be watching for exhaustion patterns, long lower wicks, or bullish reversal formations.
Risk factors that could intensify the move
Several catalysts could amplify whichever direction Cardano ultimately takes:
– Macro environment: Shifts in risk sentiment driven by interest‑rate expectations, equity market volatility, or macroeconomic data can spill over into crypto, either fueling further downside or sparking relief rallies.
– Bitcoin dominance and market correlations: If Bitcoin sells off sharply or fails to hold its own support, altcoins like Cardano often experience outsized declines as capital retreats to perceived safety or moves to stable assets.
– Liquidity conditions: As volatility compresses, liquidity can thin out. When a breakout or breakdown finally occurs, the move can be unusually violent due to a lack of resting orders on the order book.
How to navigate ADA in a neutral‑to‑bearish setup
In a structure that leans neutral‑to‑bearish, patience is a competitive advantage. Instead of chasing every small bounce, many traders wait for confirmation:
– For potential bulls: A prudent approach is to look for a genuine reclaim of the former channel region, backed by rising volume and strong closing candles, before considering aggressive long exposure. Alternatively, some may plan staggered bids at deeper support areas with predefined invalidation levels.
– For potential bears: The cleaner entries tend to appear on failed retests of broken support (now resistance) or on decisive breaks of the current fragile floor. Protective stops, position sizing, and scenario planning become vital, as short squeezes are common in oversold markets.
The role of sentiment versus structure
While news, social media narratives, and headlines can swing sentiment rapidly, the current ADA setup is defined more clearly by its chart than by opinion. The breakdown from the channel and the lack of vigorous rebound are observable facts. Until the market either proves that the breakdown was a trap (via a strong reclaim) or confirms continuation (with a breakdown of support), speculative narratives remain secondary to structure.
That said, sentiment can accelerate trends once technical signals align. A period of subdued volatility and sideways price action can suddenly give way to aggressive moves if a catalyst coincides with a technical trigger. Traders often prepare for both scenarios rather than trying to predict which one will materialize.
Medium‑term outlook: consolidation, continuation, or reversal?
Looking beyond the immediate noise, three plausible medium‑term paths emerge:
1. Consolidation within a new range: ADA could establish a sideways channel between the current support and the former trend line, forming a base. This would allow the market to digest previous gains and losses before choosing a new direction.
2. Bearish continuation: Failure to reclaim the broken structure and a breakdown through current support, especially with expanding volume, would support the view of a more extended correction toward deeper levels.
3. Bullish reclaim and trend resumption: A powerful move back above the critical resistance zone, turning it once again into support, would revive the prior uptrend narrative and potentially attract sidelined capital.
Each scenario will leave recognizable fingerprints on the chart through price action, volume behavior, and volatility shifts. Monitoring these signals can help participants avoid impulsive decisions.
What to focus on if you hold or trade ADA now
For those engaged with Cardano, a disciplined plan is more valuable than a single bullish or bearish opinion:
– Define time horizon: intraday, swing, or long‑term investing.
– Identify invalidation levels: prices at which your current thesis is wrong.
– Use position sizing: avoid overexposure in a structurally uncertain phase.
– Track key levels: previous channel support (now resistance), current floor, and deeper demand zones.
– Watch volume: expanding volume on moves often confirms direction; shrinking volume can hint at indecision or absorption.
Until ADA either decisively recovers its lost support or breaks convincingly below its present floor, the market remains in a cautious, structure‑driven state. Bulls may need to endure more pressure, and bears must guard against sudden reversals. In this environment, clarity will likely come from the chart before it arrives in the broader narrative.