Terra’s native token LUNA has exploded higher over the past week and a half, putting the asset back on traders’ radar. After defending the key $0.16 area, the obvious question is whether this move still has fuel left in the tank – and if a further 50% leg up is realistic in the short term.
Over the last 9 days, LUNA has climbed roughly 226%, with an additional surge of about 45.8% in just the previous 24 hours. Trading activity has been equally intense, with volume spiking as the price broke through short‑term resistance levels. Much of this renewed interest is being linked to the Terra Chain v2.18 upgrade, which appears to have acted as a strong catalytic event for the latest rally.
Weekly structure: first signs of a larger trend reversal
On the weekly timeframe, LUNA’s market structure is finally tilting in favor of the bulls. For now, the chart suggests that a shift to a bullish structure is underway, but confirmation hinges on a weekly close above the $0.168 zone. That level marks a former swing high that triggered the last major downward move, so reclaiming and holding it would be a signal that buyers have taken control of the higher timeframe trend.
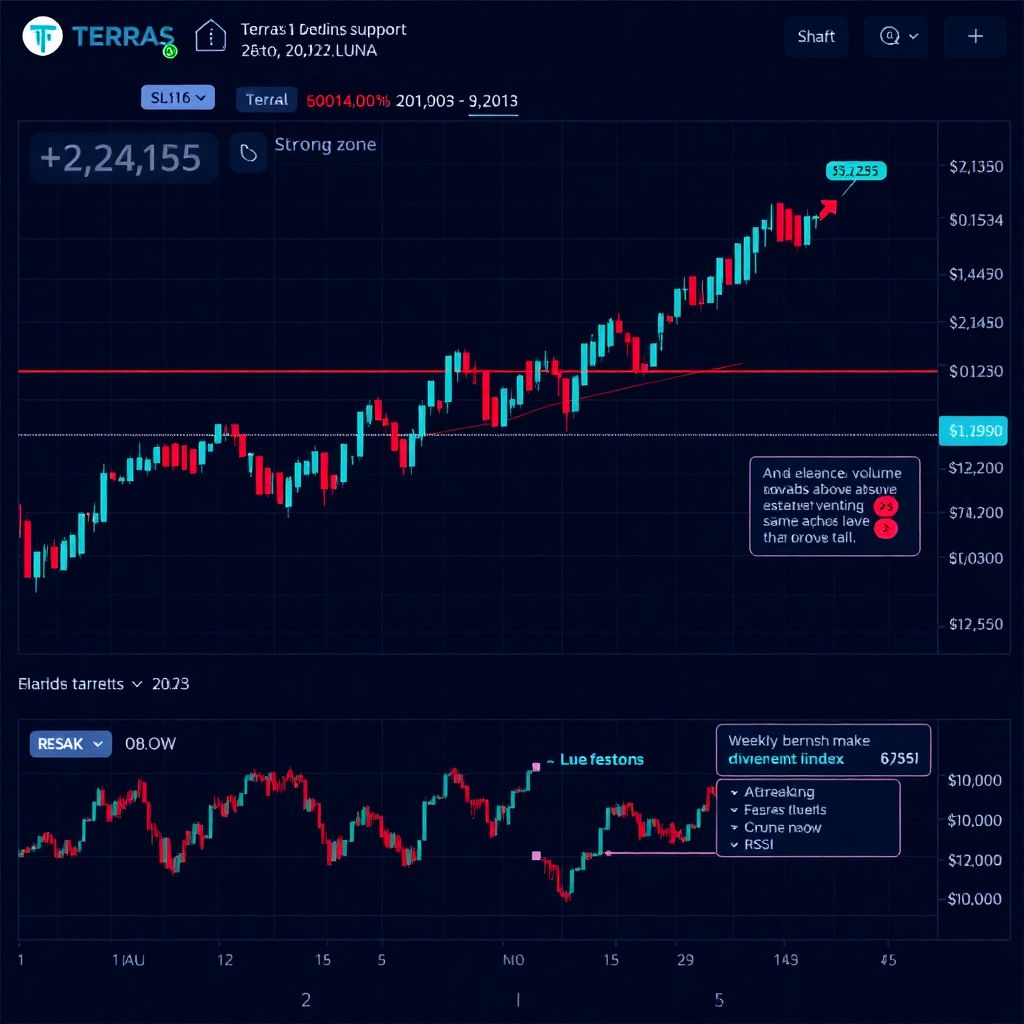
Volume indicators support this narrative. The On-Balance Volume (OBV), which tracks buy and sell pressure by combining price and volume, has already surpassed its highs from December 2024. When OBV breaks out ahead of or alongside price, it often hints that the move has genuine participation from market participants rather than being a low‑liquidity spike. For bulls, this is a constructive sign.
Momentum readings back up the case as well. The weekly Relative Strength Index (RSI) has risen above the neutral 50 mark, reflecting a transition from bearish or neutral conditions to sustained bullish momentum. While the RSI is not yet in a classic “overbought” area on the weekly chart, it does suggest that buyers are currently dictating the pace.
Looking beyond the immediate breakout, the next major horizontal resistance levels on this timeframe come in around $0.28, $0.51, and $0.72. Each of these zones represents a historical supply region where sellers previously stepped in, so they are natural candidates for profit‑taking and, potentially, corrective pullbacks.
Four-hour chart: confluence of support around $0.16
Zooming into the 4-hour chart provides a more granular view of the current setup, and it largely reinforces the bullish thesis. A clear demand zone has formed between $0.148 and $0.163 (highlighted on many charts as a cyan box), and this area overlaps with the 61.8% Fibonacci retracement level at approximately $0.155, measured from the recent impulse move.
Such confluence – a demand area aligning with a key Fibonacci level – often strengthens the reliability of the support. It suggests that dip buyers are likely to emerge on retests, viewing the region as an attractive entry for continuation trades.
Above that, there is also an imbalance (or “fair value gap”) visible on recent 4‑hour candles, represented by a white box on some analyses. These imbalances frequently act like magnets: price can revisit them to “fill” the inefficiency before resuming the dominant trend. A bullish reaction from that region adds another layer of support to the case for a continuation higher.
The combined effect is clear: any pullback in LUNA toward the $0.16 neighborhood currently looks more like a potential accumulation opportunity than an immediate sign of trend failure. For many traders, that creates a defined “buy the dip” zone with a relatively obvious invalidation level just below.
Potential warning signs: divergence and a deeper pullback
Despite the constructive picture, the shorter-term indicators are not without risk flags. On the 4‑hour timeframe, the RSI could soon print a bearish divergence – a pattern where price sets higher highs while the RSI forms lower highs. When this appears after a sharp rally, it often serves as an early warning that momentum is fading and a corrective move could follow.
If such a divergence forms and is accompanied by a meaningful increase in selling volume, the probability of a deeper pullback rises. In that scenario, a decisive break below the $0.15 region would be a clear negative for bulls, suggesting that the previously strong demand is weakening and that short‑term traders are locking in profits more aggressively.
For now, this remains a risk scenario rather than the base case. The broader weekly and 4‑hour structures trend positively, making the bearish outcome less likely unless there is a sharp shift in sentiment or an external shock. Still, traders need to be prepared for a period of volatility after such an aggressive move up.
Is a 50% extension from here realistic?
With LUNA successfully holding above $0.16 and short‑term dips being bought, a 50% extension from current levels is not out of the question. The Fibonacci extension levels provide some structure to that idea. Key upside targets lie around $0.283 and $0.34, which roughly align with a strong 50%–100% continuation leg from the defended support zone.
A push toward $0.283 would test the first major extension, and a rally to the $0.34 zone could represent a full extension of the current breakout phase. Both levels are plausible as long as the market maintains its bullish structure and the $0.16–$0.18 band continues to serve as a reliable floor.
Importantly, the previously mentioned horizontal resistance at $0.28 lines up neatly with the lower Fibonacci extension. This alignment creates a cluster of confluences around that region, making it a logical first major upside objective and a potential area where early longs might look to realize some gains.
How traders might approach the $0.16–$0.18 area
From a tactical perspective, many traders would view the $0.16–$0.18 price band as the battlefield that decides whether this rally has another leg. As long as LUNA sustains above this corridor and bounces on retests with healthy volume, it supports the idea of further upside.
A common approach in such situations is to:
– Look for entries on dips into the $0.16–$0.18 region rather than chasing vertical green candles.
– Use local lows just below the demand zone (for example, sub‑$0.15) as an invalidation or stop‑loss area.
– Target the Fibonacci extension levels near $0.283 and $0.34 as primary profit zones, potentially scaling out on the way up rather than holding for a single “all or nothing” exit.
At the same time, some traders will wait for confirmed consolidation above $0.168 on the weekly close before committing more capital, treating that confirmation as evidence that the higher timeframe trend has genuinely flipped.
Risk management and the reality of parabolic moves
Rallies of more than 200% in under two weeks are, by nature, unstable. They often attract short‑term speculators, and the order book can thin out as price moves quickly, amplifying volatility. Even in a structurally bullish environment, such moves are frequently followed by sharp, fast corrections that can wipe out a large chunk of the upside in a matter of hours or days.
Because of this, risk management becomes crucial. Traders focusing on LUNA at these levels typically:
– Size positions conservatively, assuming that 20–30% intraday swings are possible.
– Avoid over‑leveraging, since liquidation risk increases dramatically during violent pullbacks.
– Plan exits ahead of time around known resistance levels like $0.28, $0.51, and $0.72, rather than relying on emotions in the heat of the moment.
It is also important to remember that a rising OBV and strong RSI do not guarantee a straight‑line move higher. They indicate favorable conditions, but the market can still move against expectations, especially in an asset with LUNA’s history of volatility.
What could invalidate the bullish scenario?
While the current structure leans bullish, traders should keep an eye on a few key invalidation signals:
1. Loss of the $0.16 support with heavy volume
A decisive break below $0.16, particularly if accompanied by a surge in sell volume and a falling OBV, would suggest that demand has dried up and that larger players may be offloading positions.
2. Weekly close back below $0.168 after a fake breakout
If price briefly moves above $0.168 but then closes the week well below that level, it could indicate a “bull trap,” where late buyers get caught at the top of the move.
3. Sustained bearish divergence on lower timeframes
Isolated divergences are common and can simply lead to small pullbacks, but multiple lower highs on the RSI combined with higher highs on price across several sessions often precede a deeper correction.
If these conditions emerge, the probability of a continued 50% rally diminishes, and the market might enter a consolidation phase or even reverse part of the gains.
Medium-term outlook for LUNA holders
For existing LUNA holders, the current environment offers both opportunity and risk. On one hand, the emergence of a bullish weekly structure and strong volume profile suggests that sentiment is improving and that the asset might be transitioning out of a prolonged downtrend. On the other hand, the speed of the recent surge means that taking partial profits at notable resistance zones is a rational strategy for those worried about drawdowns.
The resistance cluster around $0.28, and later $0.51 and $0.72, can act as checkpoints where holders reassess their positions. Some may choose to lock in gains gradually as each level is tested, while others may ride the trend longer if momentum tools and volume continue to support the move.
Final considerations
Putting it all together, LUNA’s defense of the $0.16 level, combined with bullish signals on both the weekly and 4‑hour charts, provides a constructive backdrop for the possibility of another 50% upside move. The confluence of demand around $0.16–$0.18, strong OBV, and positive RSI readings, along with clear Fibonacci extension targets at $0.283 and $0.34, all argue in favor of a continuation as long as key supports hold.
However, traders and investors should treat these signals as probabilities, not certainties. Sharp rallies can reverse quickly, and technical setups can fail. Anyone considering exposure to LUNA needs to align their strategy with their own risk tolerance, use clear invalidation levels, and be prepared for significant volatility along the way.