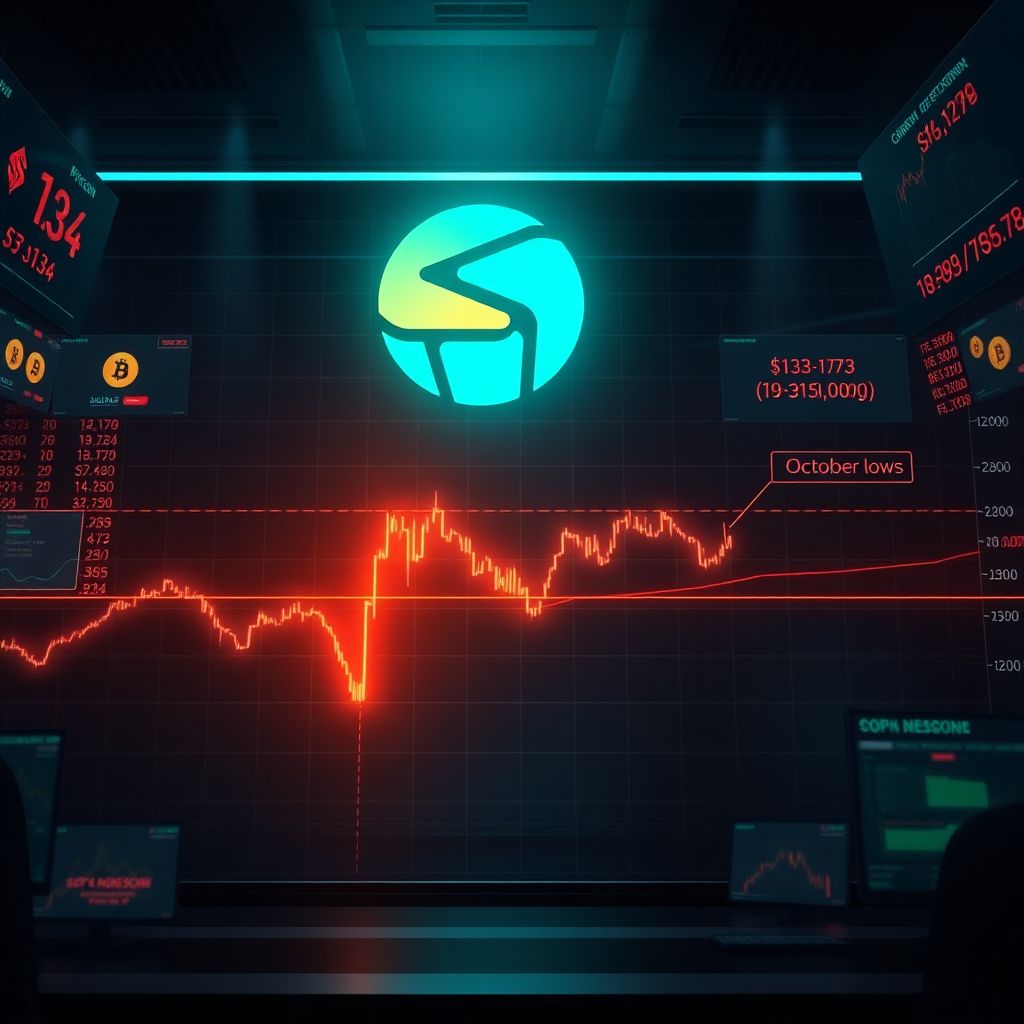
Solana breaks key support as crypto sell-off deepens, tests October lows
Solana extended its recent slide on Tuesday, slicing through a key support zone as renewed selling swept across the broader digital asset market. The token dropped about 5.4% intraday to roughly 133–134 dollars, cementing a weekly loss of around 13.4% and dragging prices back toward levels last seen in late October, according to market data.
The move was technically significant. Solana slipped beneath a well-watched psychological barrier that had repeatedly flipped between support and resistance throughout the fourth quarter. Once that floor gave way, a wave of automated selling and stop-loss triggers accelerated the move lower, pushing SOL toward the bottom of its recent trading range.
By late Wednesday, Solana was hovering near 134 dollars, still down around 4.6% on the day, with the market struggling to find a firm footing.
Liquidity thins as trading volume shrinks
The sell-off came on notably lighter activity. Trading volume in Solana (SOL) dropped roughly 26.7% over a 24‑hour period, pointing to reduced market participation even as prices fell. That combination—a declining price with softening volume—often signals that some traders are stepping back rather than aggressively capitulating.
However, thinner liquidity can cut both ways. While it may suggest that panic has not fully taken hold, it can also amplify volatility, allowing relatively modest sell or buy orders to push price more sharply in either direction.
Contagion from Bitcoin pressure and ETF outflows
Solana’s pullback did not happen in isolation. The broader crypto complex has been under pressure, led by renewed weakness in Bitcoin and ongoing outflows from several exchange‑traded products tied to digital assets. As large players rebalance or trim exposure to Bitcoin, risk sentiment tends to deteriorate across altcoins as well, leaving high‑beta assets like Solana exposed to steeper swings.
In this environment, even positive fundamental headlines are struggling to gain traction. Macro uncertainty, shifting expectations around interest rates, and profit‑taking after a strong year‑to‑date rally have all fed into the latest downturn.
Technical picture: from support to resistance
From a charting standpoint, the damage is visible across multiple timeframes:
– Solana has slipped below all major short‑term moving averages, including the seven‑day simple moving average (SMA).
– That seven‑day SMA, which recently acted as a dynamic support line, has now flipped into resistance, effectively capping intraday rebound attempts.
– Both the four‑hour and daily charts are showing what analysts describe as “clean breakdowns,” with price closing below prior support areas that had previously contained pullbacks.
The Moving Average Convergence Divergence (MACD) indicator remains in negative territory, confirming that downside momentum is still dominant. That said, the MACD histogram is beginning to curl upward, hinting that the pace of selling may be starting to slow, even if a trend reversal is not yet confirmed.
The next “real” safety net: October support zone
With near‑term supports broken, traders are now focused on a deeper zone that last held in late October. This area, just above the 120‑dollar mark according to some technical models, is viewed as Solana’s next meaningful safety net.
If price can stabilize and consolidate above that band, it would suggest that buyers are willing to defend longer‑term positions and could set the stage for a base‑building phase. If that support fails decisively, analysts warn that the decline could accelerate, opening the door to a more pronounced correction as leveraged positions unwind and risk appetite retreats.
What would a bullish reversal require?
Technicians outline a clear threshold for Solana to shake off its current bearish structure: a sustained daily close back above the seven‑day SMA. Until that level is reclaimed, any intraday rallies are expected to face heavy selling pressure from traders looking to sell into strength or re‑establish short positions.
In practice, a constructive reversal would likely require:
– A daily close above the seven‑day SMA
– Follow‑through buying that pushes price toward the next resistance zone
– A flattening, then upward turn, in short‑term moving averages
– A crossover or at least a clear improvement in the MACD and momentum oscillators
Absent these signals, the path of least resistance remains lower or sideways, with rallies viewed as potential bull traps rather than the start of a new uptrend.
Short‑term sentiment: altcoins under pressure
Across the altcoin space, risk appetite remains subdued. Market participants are favoring higher‑quality, more liquid assets and are quick to de‑risk when Bitcoin wobbles. In this climate, Solana’s recent ecosystem milestones and capital markets developments have not been enough to override the macro‑driven sell pressure.
Short‑term traders are cautious, and funding rates on derivatives platforms have cooled from prior exuberant levels. That reduction in speculative froth can ultimately be healthy, but in the moment it also removes a source of aggressive dip‑buying.
Institutional interest grows despite price pullback
Ironically, the sell‑off arrives as institutional access to Solana is expanding. This week, VanEck rolled out a Solana‑focused exchange‑traded fund on a major US stock exchange, designed to give professional and institutional investors direct exposure to SOL. The product launched with waived initial fees and a structure that passes staking rewards through to investors, aiming to make it more attractive compared with traditional passive funds.
Earlier, in late October, Grayscale introduced a spot Solana investment vehicle that rapidly accumulated significant assets. That fund also shares staking yields with investors after a fee reduction, underscoring a broader shift: major asset managers are increasingly treating Solana as a core component of digital asset portfolios rather than a fringe speculative token.
These developments highlight a crucial disconnect in the short term: while price is under pressure, the infrastructure for long‑horizon, regulated exposure to Solana is quietly being built out.
Oversold signals emerge on lower timeframes
On shorter timeframes, some technical indicators are approaching oversold territory. Oscillators such as the Relative Strength Index (RSI) on two‑hour and four‑hour charts are drifting into zones that have historically preceded at least temporary bounces.
Analysts caution, however, that oversold conditions do not guarantee an immediate rebound. Markets can stay oversold longer than many traders expect, particularly during strong downtrends. For bulls, the critical step is not just printing an oversold reading but reclaiming the seven‑day SMA and turning previous resistance levels back into support.
Until that happens, any short‑lived bounce may simply relieve selling pressure before the broader downtrend resumes.
What this means for traders and investors
For short‑term traders, Solana’s break of key support changes the tactical playbook:
– Breakdowns below prior floors tend to favor trend‑following or mean‑reversion trades with shorter holding periods.
– Stops and risk limits become more important, given the potential for sharp intraday swings in a thin‑volume environment.
– Clear invalidation levels—such as a daily close back above the seven‑day SMA—can help define when a bearish thesis is no longer valid.
Longer‑term investors may read the pullback differently. For those who believe in Solana’s technology, network effects, and growing institutional infrastructure, the correction could be viewed as an opportunity to accumulate at a discount, provided they are prepared to tolerate further volatility and potential drawdowns.
Fundamental backdrop: beyond the charts
Despite the recent price action, Solana’s ecosystem continues to evolve. Developer activity, application launches, and on‑chain usage metrics are still central to the long‑term investment case, even if they often get overshadowed during acute market moves.
Key fundamental narratives include:
– Ongoing efforts to improve network performance and stability
– The growth of decentralized finance and gaming projects building on Solana
– The role of staking yields as a component of total return for long‑term holders
– Increasing integration of Solana into portfolios managed by professional asset allocators
These factors do not immunize the token from macro sell‑offs, but they shape how quickly capital may return once risk appetite recovers.
Risk scenarios to watch
Looking ahead, market participants are closely monitoring several potential catalysts:
– Whether Bitcoin stabilizes or continues to drag the broader market down
– The persistence or reversal of ETF outflows from crypto‑linked products
– Macro data that could shift expectations for interest rates and liquidity
– Any regulatory developments that could affect institutional participation in Solana‑related products
If external pressure eases and Solana successfully defends its October‑era support zone, a period of consolidation could follow, giving the market time to absorb recent gains and resets. A decisive break below that safety net, by contrast, would likely force traders to reassess downside targets and risk exposure.
For now, Solana sits at a technical crossroads: structurally bearish in the short term, increasingly integrated into institutional frameworks in the long term, and heavily influenced by the same macro forces shaking the wider crypto market.